

HOT TOPICS LIST
- MACD
- Fibonacci
- RSI
- Gann
- ADXR
- Stochastics
- Volume
- Triangles
- Futures
- Cycles
- Volatility
- ZIGZAG
- MESA
- Retracement
- Aroon
INDICATORS LIST
LIST OF TOPICS
PRINT THIS ARTICLE
by Donald W. Pendergast, Jr.
The US Dollar futures sold off steadily over the past month but have now reversed higher after successfully testing a key support area.
Position: N/A
Donald W. Pendergast, Jr.
Freelance financial markets writer and online publisher of the Trendzetterz.com S&P 500 Weekly Forecast service.
PRINT THIS ARTICLE
REVERSAL
US Dollar Index: Bullish Reversal
10/08/13 02:22:20 PMby Donald W. Pendergast, Jr.
The US Dollar futures sold off steadily over the past month but have now reversed higher after successfully testing a key support area.
Position: N/A
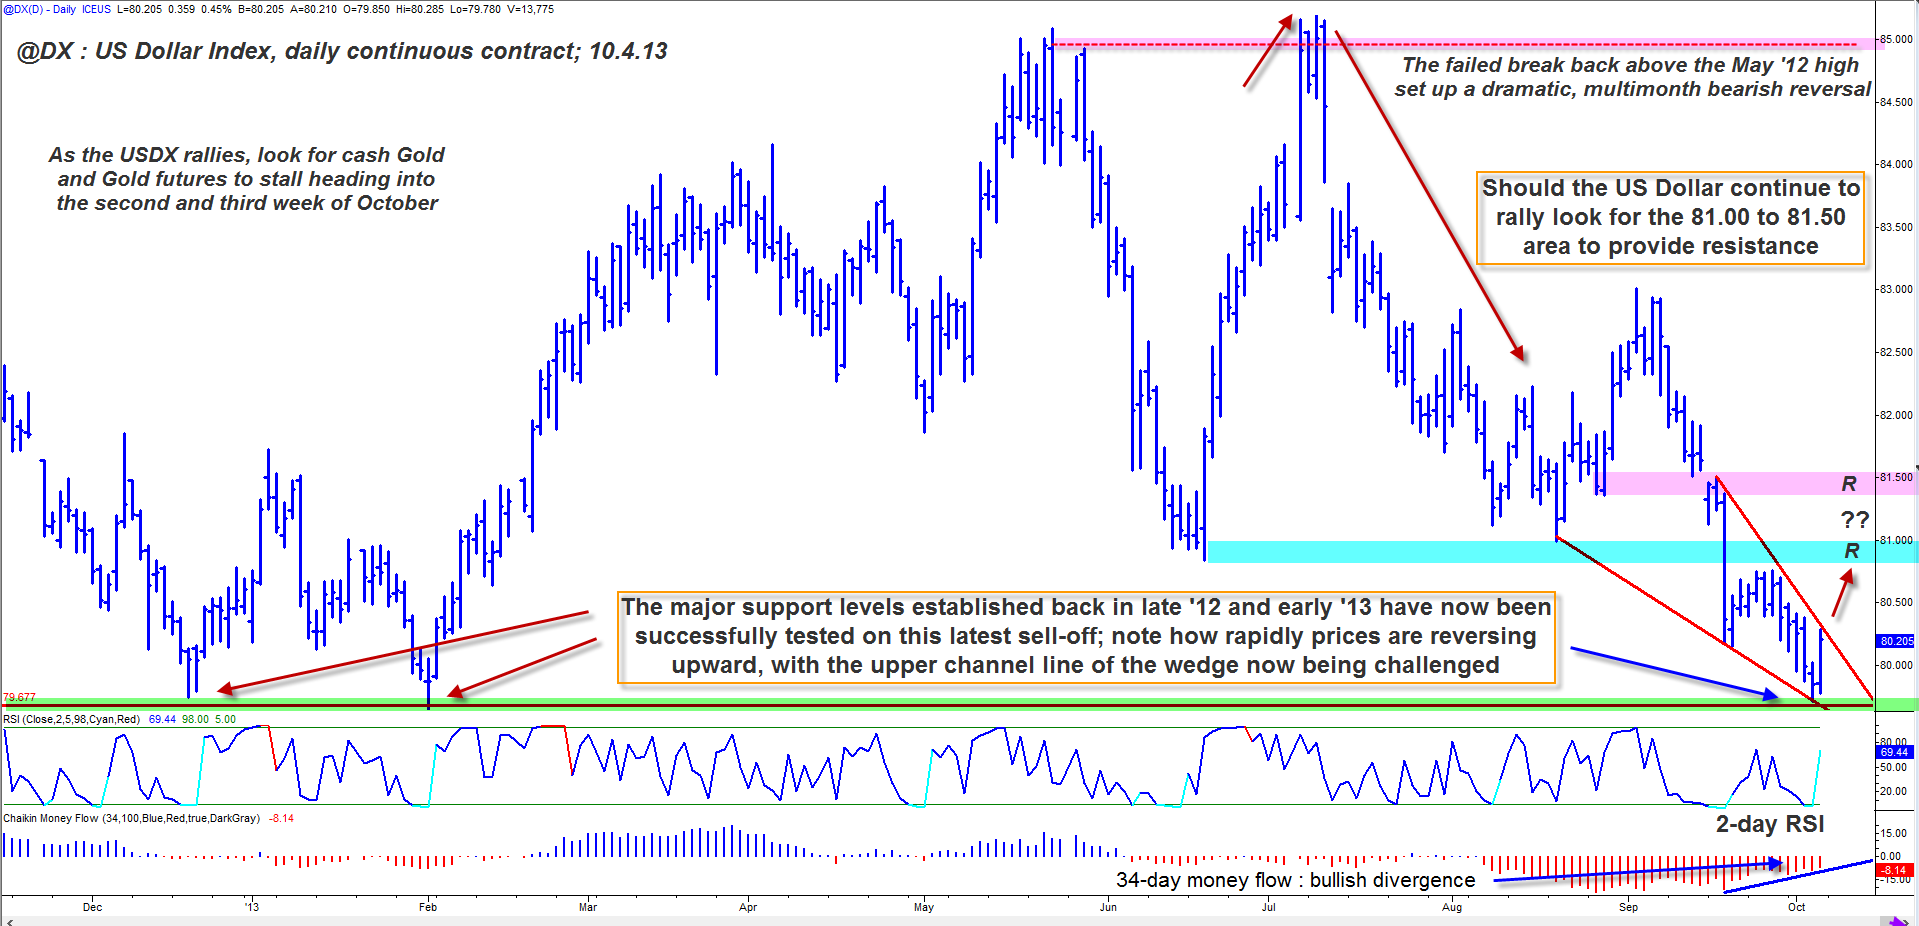
| Major currencies don't normally make the same kind of dramatic price moves that stock indexes and/or their component stocks do, but they still make nice swing and/or trending moves on numerous time frames that savvy traders can profit from. Here's a look at the new bullish reversal that is taking shape in the US Dollar index (@DX, DX#F, UUP) futures, using the daily continuous contract (Figure 1). |
|
| Figure 1. After two significant swing moves lower since early July 2013, the US Dollar index futures now appears ready to break higher out of its ever-narrowing, bullish pennant pattern. |
| Graphic provided by: TradeStation. |
| |
| While a "mere" 3.96% decline in the USDX between August 3 and September 3, 2013 appears to be relatively small, futures traders who caught a substantial part of that downdraft probably did well for themselves; since each full point on the contract is worth $1,000, catching just two full points of that 3.29-point selloff would have garnered $2,000 profits per contract (before commissions and slippage). Forex (FX) traders who bought the EUR/USD (Euro/US Dollar) pair or shorted the USD/CHF (US Dollar/Franc) as the USDX fell would also have made good profits, particularly if trading at better than 50:1 leverage. In the highly leveraged world of currency trading — whether by way of futures contracts or the FX markets — even small swing moves of 1-2% can mean big gains for skilled traders. For unskilled traders who trade without a proven strategy and risk control/money management protocol, even those small swings could be enough to wipe out their trading account equity. Skilled FX/currency futures traders once again have a potentially profitable bullish reversal setup — in the USDX — and the technical evidence in support of further gains is compelling: 1. The index just completed a successful test of multi-month daily chart support after descending to the 79.72 area rallying sharply from this key level, one that has already served as strong support on two other instances (December 2012 and February 2013) since the major October 2012 low was set at the 79.85 area. 2. Notice the bullish price/money flow divergence, using the 34-day Chaikin money flow (CMF)(34) histogram as a guide. This indicated accumulation was underway to some extent in the two weeks prior to the current reversal. 3. Note the triangle pattern and how quickly the index is surging up to meet the upper channel line; if/when this is broken, it should be the catalyst for some more buying pressure to drive the USDX higher — and the Euro lower. 4.The two-day RSI's buy signal was already triggered during Friday's trading in USDX futures; note that the RSI reading had dipped as low as 2.25 by the close of Thursday's trading in the futures; a subsequent rise of the USDX above Thursday's high of 80.02 was the defacto buy entry point for shorter-term, mean-reversion traders looking to capitalize on a fast one to three day rally. Swing traders looking for a longer rally could also have used that trigger to put on smaller-sized positions. |
|
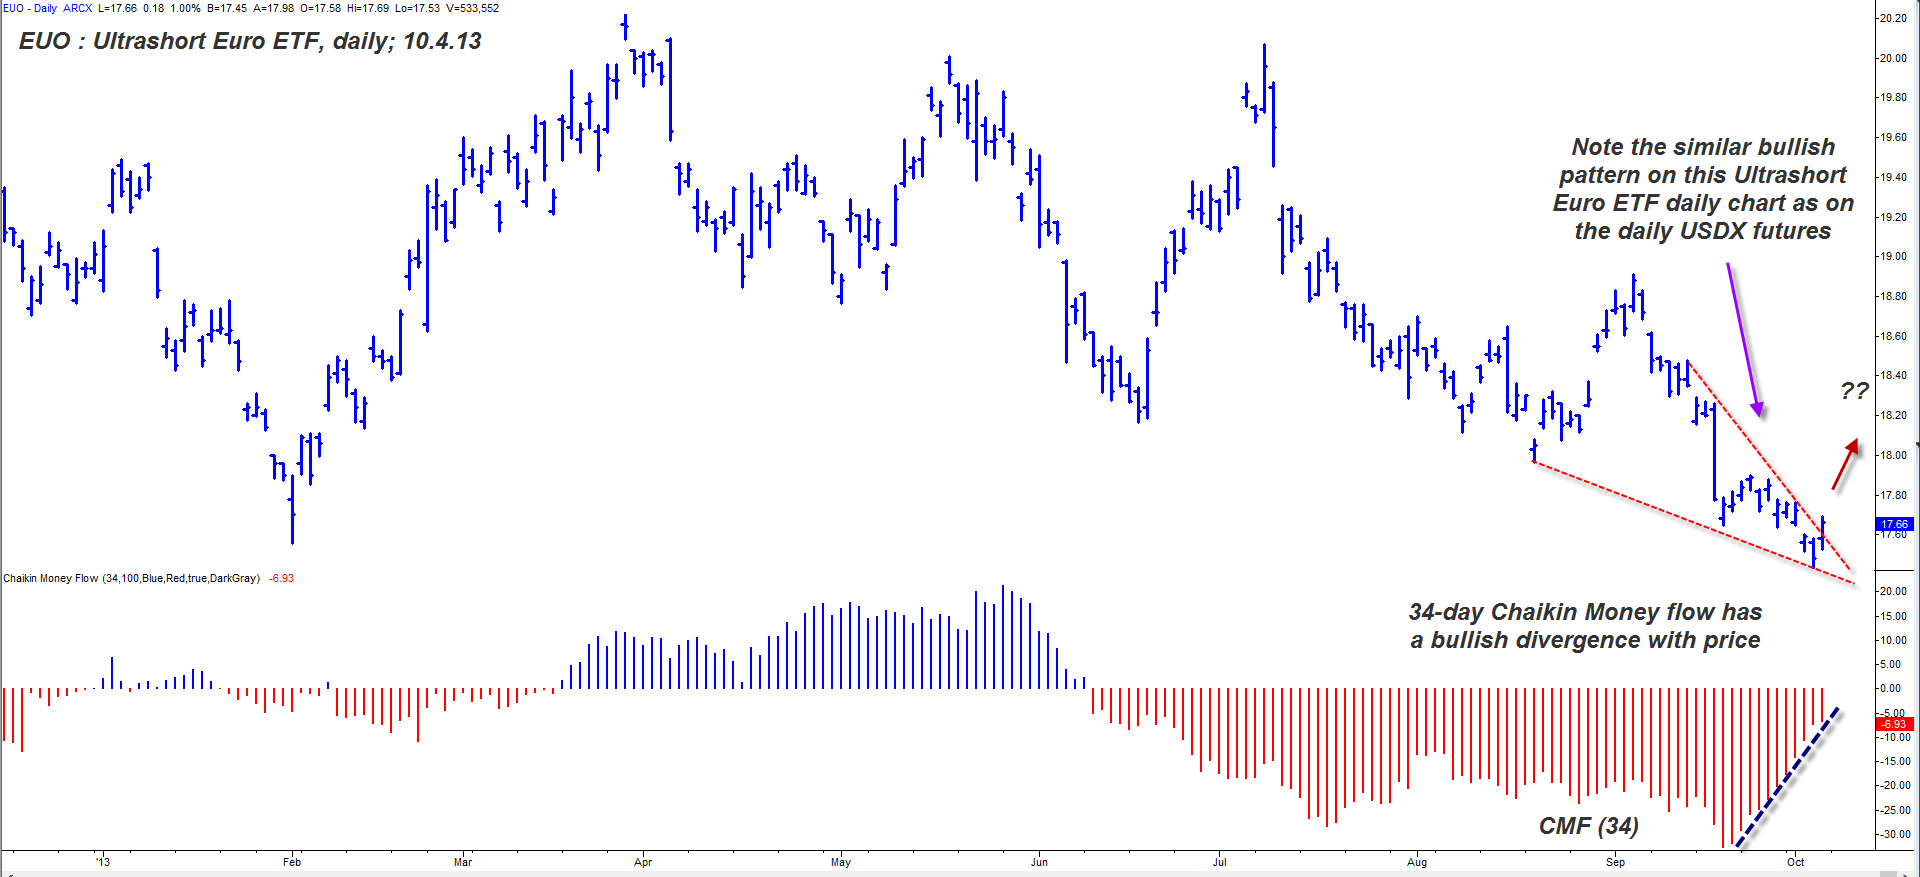
| Figure 2. The daily chart of the ProShares Ultra Short Euro ETF (EUO) is manifesting much the same price and money flow patterns as the USDX chart is. Buying this ETF is the equivalent of taking a 2x leveraged short position in the Euro currency, but without the extreme risk of trading the futures or Forex markets. |
| Graphic provided by: TradeStation. |
| |
| USDX traders relying on daily charts to guide their trading plan would do well to note the two key resistance levels that the index will meet as it rises; the first one is shaded in cyan and is near the 80.85 to 81.00 area, while the higher one is located between the 81.40 to 81.50 area. These can be logical places in which to set profit targets, should the new rally get that high in the next week or two. As far as managing this developing trade, a simple two- to three-bar trailing stop of the daily lows should be sufficient, unless you want to go with a volatility-based trailing stop instead. If you look at the rally coming out of its June 19, 2013 cycle low you'll discover that a simple two-bar trailing stop of the daily lows would have kept you in that rally until final stop out on July 10, 2013, and with a gain of nearly 3%. No one knows if this new rally will catch a serious bid and fly, but it's a great learning example of the power of using a wisely-selected trailing stop. Be aware of the inverse correlation between the US dollar and Euro. You can typically trade the Euro futures or EUR/USD using this same plan of attack, only in reverse, looking for the euro to sell off as the US Dollar gains. Regardless of the kind of initial/trailing stops you elect to use, keep your trade risks small, at no more than 1-2% of your account value, no matter how bullish this trade setup appears to you. Trade wisely until we meet here again. |
Freelance financial markets writer and online publisher of the Trendzetterz.com S&P 500 Weekly Forecast service.
| Title: | Market consultant and writer |
| Company: | Trendzetterz |
| Address: | 81 Hickory Hollow Drive |
| Crossville, TN 38555 | |
| Phone # for sales: | 904-303-4814 |
| Website: | trendzetterz.com |
| E-mail address: | support@trendzetterz.com |
Traders' Resource Links | |
| Trendzetterz has not added any product or service information to TRADERS' RESOURCE. | |
Click here for more information about our publications!
Comments

Request Information From Our Sponsors
- StockCharts.com, Inc.
- Candle Patterns
- Candlestick Charting Explained
- Intermarket Technical Analysis
- John Murphy on Chart Analysis
- John Murphy's Chart Pattern Recognition
- John Murphy's Market Message
- MurphyExplainsMarketAnalysis-Intermarket Analysis
- MurphyExplainsMarketAnalysis-Visual Analysis
- StockCharts.com
- Technical Analysis of the Financial Markets
- The Visual Investor
- VectorVest, Inc.
- Executive Premier Workshop
- One-Day Options Course
- OptionsPro
- Retirement Income Workshop
- Sure-Fire Trading Systems (VectorVest, Inc.)
- Trading as a Business Workshop
- VectorVest 7 EOD
- VectorVest 7 RealTime/IntraDay
- VectorVest AutoTester
- VectorVest Educational Services
- VectorVest OnLine
- VectorVest Options Analyzer
- VectorVest ProGraphics v6.0
- VectorVest ProTrader 7
- VectorVest RealTime Derby Tool
- VectorVest Simulator
- VectorVest Variator
- VectorVest Watchdog