HOT TOPICS LIST
- MACD
- Fibonacci
- RSI
- Gann
- ADXR
- Stochastics
- Volume
- Triangles
- Futures
- Cycles
- Volatility
- ZIGZAG
- MESA
- Retracement
- Aroon
INDICATORS LIST
LIST OF TOPICS
PRINT THIS ARTICLE
by Donald W. Pendergast, Jr.
Learning what to look for when evaluating a breakout stock candidate can help make your pathway to profits much easier.
Position: N/A
Donald W. Pendergast, Jr.
Freelance financial markets writer and online publisher of the Trendzetterz.com S&P 500 Weekly Forecast service.
PRINT THIS ARTICLE
BREAKOUTS
DANG: An Instructive Chart Setup
10/04/13 03:44:01 PMby Donald W. Pendergast, Jr.
Learning what to look for when evaluating a breakout stock candidate can help make your pathway to profits much easier.
Position: N/A
| Unless you're a skilled day trader or short-term swing trader, chances are that learning to spot flat base breakout setups on daily or weekly charts can lead to a less frantic, less stressful, and more profitable trading regimen for you. Here's a recent "start to finish" example of a successful flat base breakout setup in one of today's fast moving e-commerce stocks. |

|
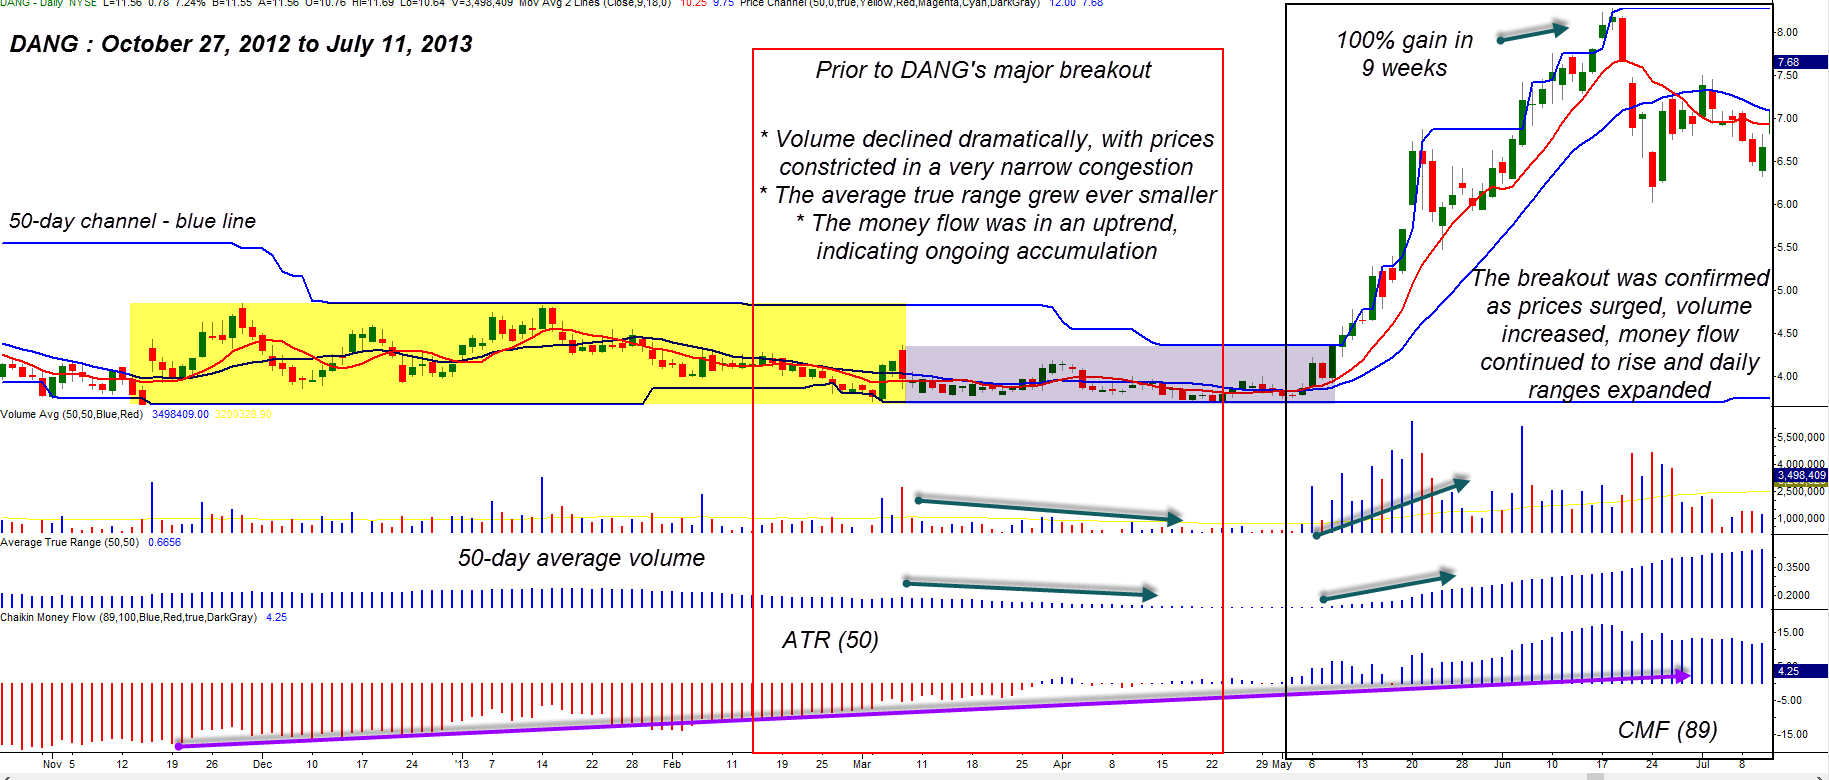
| Figure 1. Not every flat base breakout works this spectacularly, but the ones that do all seem to have an improving quarterly earnings trend in force prior to the big break higher. |
| Graphic provided by: TradeStation. |
| |
| Sometimes tech and e-commerce stocks are hot — other times they're not — but it's the ability to spot the "in between" periods when they begin to provide tell-tale clues that they intend to transition from narrow-range, ongoing congestion patterns into manic, near-runaway rallies that can lead to a great deal of profit in a minimum amount of time. Learning to identify attractive flat base breakout candidates takes time, practice, and lots of patience, but if you get at least a few of the odds set firmly in your favor, you will be way ahead of the "rest" of the retail traders who usually miss the first explosive break higher. So, on to our daily chart of E-Commerce China Dangdang (DANG) in Figure 1; the six and a half month long consolidation phase (yellow and purple shading) was indeed long and drawn out, with the stock seemingly stuck in a ditch, unable to gain any real traction to break higher or lower, simply meandering back and forth. You would think that a skilled trader or long-term investor would turn their nose up at such a dead-looking equity, especially given that it had been trading as high as $11.25/share in April 2012 — before plunging down to a mere $3.68/share only seven months later, but that's where one of the keys to locating great breakout plays begins — with the fundamentals that drive the stock and its industry group. DANG is a business-to-consumer online marketer of books, beauty, personal care, and other household items in China, and although it continues to have negative earnings, since September 2012, its quarterly EPS (earnings per share) trend has reversed and is now in an uptrend. In fact, the company is expected to be profitable sometime during 2015, should the current EPS growth trend continue. Anyone who remembers the early years of Amazon.com (AMZN) has already seen a version of this same story play out over the past 17 years — and with an amazingly profitable outcome, too. While no one knows if DANG will eventually achieve the same degree of success as Amazon.com, the "smart money" apparently were more than willing to start accumulating DANG — with gusto — starting around late December 2012. Then as DANG tested its 3.68 low on two occasions in March and April 2013, the "smart money" really ramped up their buying of the stock — the trend of the 89-day Chaikin Money flow (CMF)(89) histogram makes this crystal clear. As all of this was happening, the stock's 50-day average true range (ATR) withered down to almost nothing along with the 50-day average trading volume (see arrows at bottom of chart). The blue 50-day price channel also worked its way lower during the long accumulation phase until May 6, 2013 when DANG shot higher like a cannonball ball; * The daily range on the breakout was 37 cents, a full 2.71 times greater than the 50-day ATR of 13.64 cents. * The daily volume on the breakout was 2.8 million shares, a full 4.19 times increase over the 50-day average trading volume of 670,356 shares. DANG also blasted above both its 20- and 50-day price channels on the move, and the rally was an absolute "go." By mid-June 2013, DANG had surged as high as $8.28/share, up by more than 100% from the channel line breakout point of $4.01/share. Not all flat base breakouts work out as nicely as this one did, but for those who understand that the fundamentals of the stock matter at least as much as the technicals do, the job of identifying this as a potentially profitable setup — and then actually trading it with real money — was just that much easier. |

|
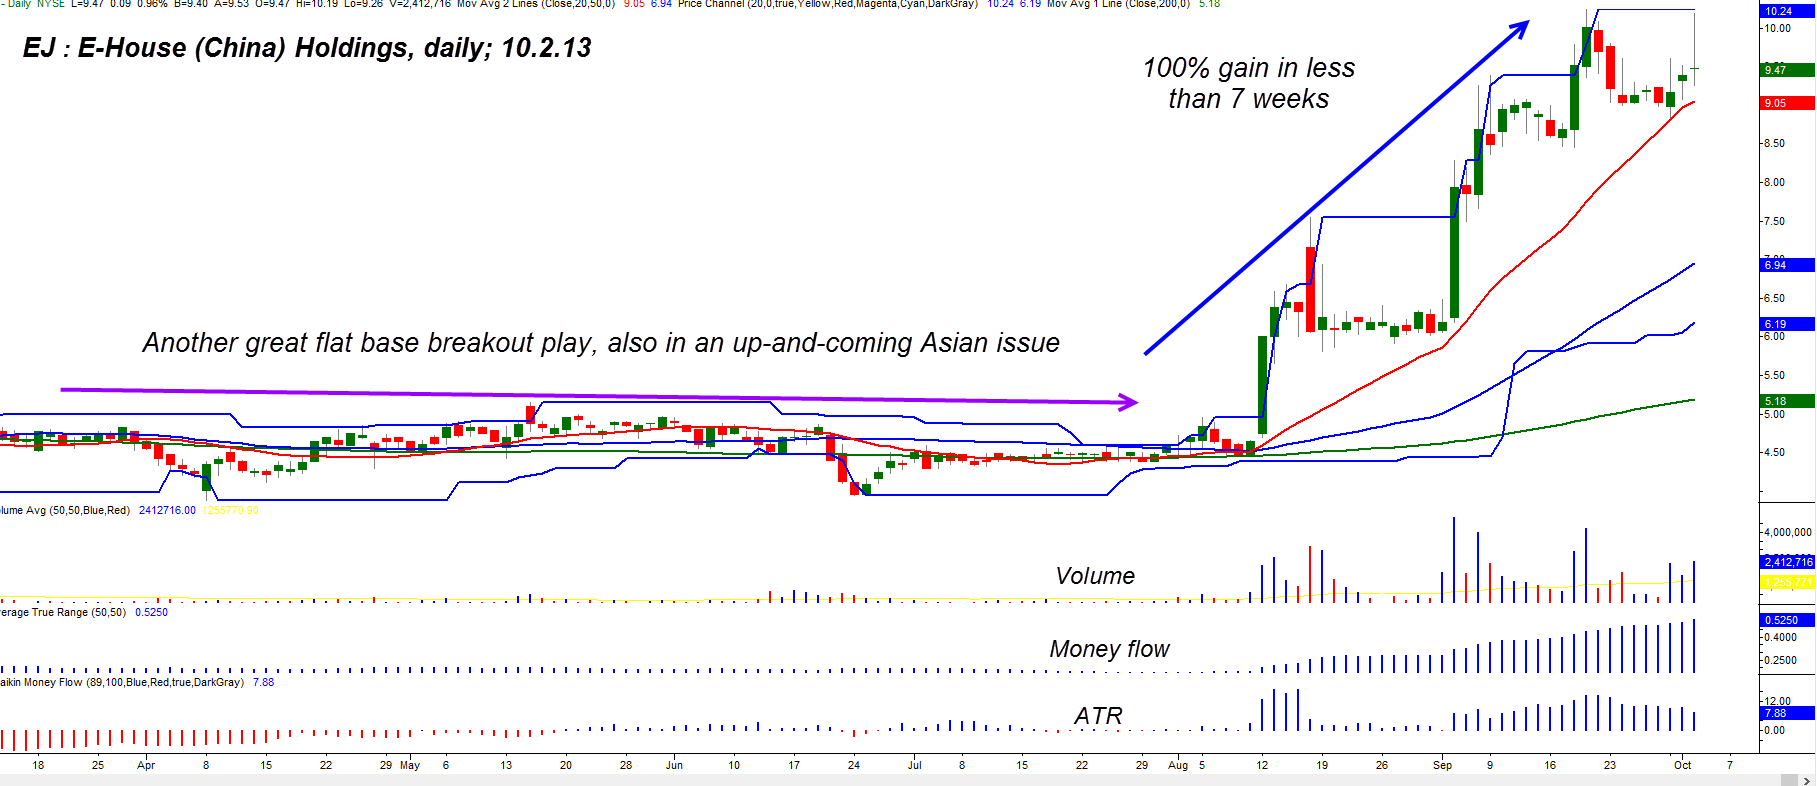
| Figure 2. E-House (China) Holdings (EJ). Yet another successful flat base breakout play, also in a Chinese equity; the similarity to the setup in DANG is quite remarkable, although EJ's breakout occurred 13 weeks after DANG's. |
| Graphic provided by: TradeStation. |
| |
| The next time you scan for stocks that have dropped 40, 50 or even 80% over the most recent six to 12 month period, take some time and perform the following tasks: 1. See if its daily chart is showing signs of accumulation, using an 80 to 120-day Chaikin Money Flow (CMF) histogram. 2. Check to see it the stock is in a long-term basing pattern, one featuring ever-smaller daily price ranges and volume trends. 3. If the first two items are confirmed, check the quarterly earnings trend (using Investor's Business Daily, for example) of the stock. Has the trend turned positive at some point during the basing process? If so, put the stock on your watch list and begin to monitor it for breaks back above its 20- and 50-day price channels. If you see it break either of these key levels on at least 3 times the average daily volume and with a daily range that is at least two to three times the average of the previous 50 days, you've just found yourself a stock that is poised to attract even more hungry buyers in the days and possibly weeks that follow. You still need to limit your account risk and have a way to trail the position, too; if it's a sub $5 stock, consider giving it at least an 8 to 10% trailing stop. If it's priced at more than $5 per share and has good trading volume, try a volatility trailing stop instead, set to 2 to 2.5 times the 10-day ATR. If you get an especially generous amount of open gains, you might even tighten the trail somewhat or even take some gains off the table; the ways to manage the trade should be dictated by general market conditions and your own good judgment. Trade wisely until we meet here again. |
Freelance financial markets writer and online publisher of the Trendzetterz.com S&P 500 Weekly Forecast service.
| Title: | Market consultant and writer |
| Company: | Trendzetterz |
| Address: | 81 Hickory Hollow Drive |
| Crossville, TN 38555 | |
| Phone # for sales: | 904-303-4814 |
| Website: | trendzetterz.com |
| E-mail address: | support@trendzetterz.com |
Traders' Resource Links | |
| Trendzetterz has not added any product or service information to TRADERS' RESOURCE. | |
Click here for more information about our publications!
PRINT THIS ARTICLE

Request Information From Our Sponsors
- StockCharts.com, Inc.
- Candle Patterns
- Candlestick Charting Explained
- Intermarket Technical Analysis
- John Murphy on Chart Analysis
- John Murphy's Chart Pattern Recognition
- John Murphy's Market Message
- MurphyExplainsMarketAnalysis-Intermarket Analysis
- MurphyExplainsMarketAnalysis-Visual Analysis
- StockCharts.com
- Technical Analysis of the Financial Markets
- The Visual Investor
- VectorVest, Inc.
- Executive Premier Workshop
- One-Day Options Course
- OptionsPro
- Retirement Income Workshop
- Sure-Fire Trading Systems (VectorVest, Inc.)
- Trading as a Business Workshop
- VectorVest 7 EOD
- VectorVest 7 RealTime/IntraDay
- VectorVest AutoTester
- VectorVest Educational Services
- VectorVest OnLine
- VectorVest Options Analyzer
- VectorVest ProGraphics v6.0
- VectorVest ProTrader 7
- VectorVest RealTime Derby Tool
- VectorVest Simulator
- VectorVest Variator
- VectorVest Watchdog
