HOT TOPICS LIST
- MACD
- Fibonacci
- RSI
- Gann
- ADXR
- Stochastics
- Volume
- Triangles
- Futures
- Cycles
- Volatility
- ZIGZAG
- MESA
- Retracement
- Aroon
INDICATORS LIST
LIST OF TOPICS
PRINT THIS ARTICLE
by Donald W. Pendergast, Jr.
Shares of Quicksilver Resources have staged a strong flat-base bullish breakout, with more gains anticipated.
Position: N/A
Donald W. Pendergast, Jr.
Freelance financial markets writer and online publisher of the Trendzetterz.com S&P 500 Weekly Forecast service.
PRINT THIS ARTICLE
BREAKOUTS
Quicksilver Resources: Breaking Higher From Base
10/03/13 03:34:11 PMby Donald W. Pendergast, Jr.
Shares of Quicksilver Resources have staged a strong flat-base bullish breakout, with more gains anticipated.
Position: N/A
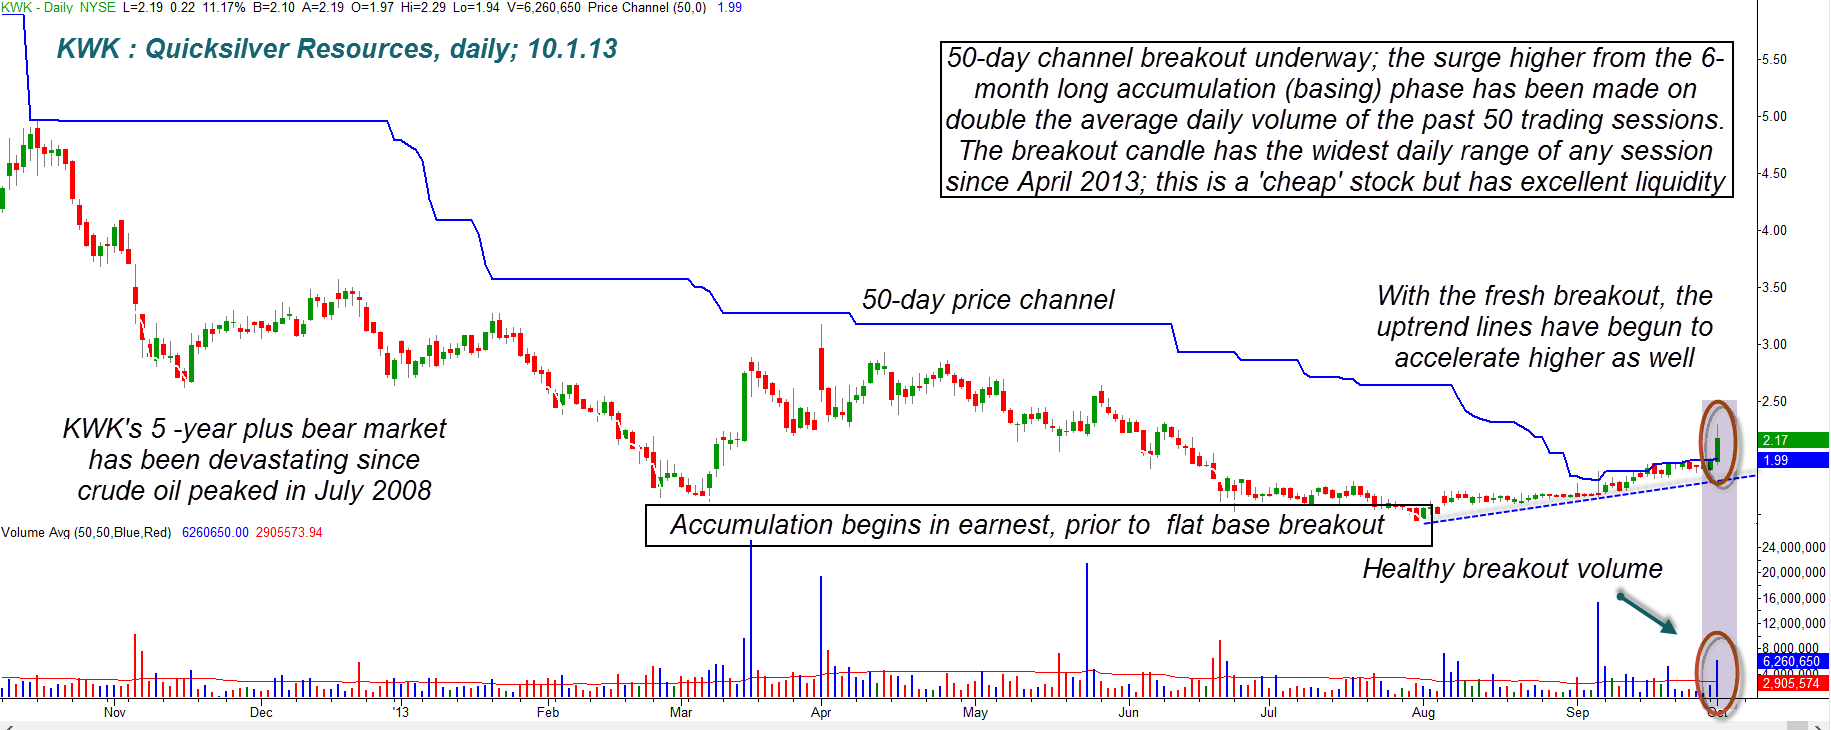
| Since making what appears to be a major, multicycle, multiyear low on August 1, 2013, Quicksilver Resources (KWK) is up by better than 50% — going from 1.44 per share to 2.17 (Figure 1). On a dollars and cents basis, the move is indeed small — especially since KWK once traded at better than $43 per share in the spring of 2008. The stock then went on to lose 95% of its value by mid-summer 2013, and really looked like a lost cause to all but the most savvy "value" and technical traders and investors. Here's a closer look at KWK's newfound strength, along with some potential near-term price targets for swing traders. |

|
| Figure 1. Quicksilver Resources (KWK) has successfully completed a flat-base breakout; long-term traders may want to manage the trade with a wide trailing stop, adding on at key pullback levels. Short-term traders should focus on taking profits near 2.64 and/or 2.86. |
| Graphic provided by: TradeStation. |
| |
| Each flat-base breakout setup pattern is unique, but most have at least some of the following price chart characteristics: 1. The pattern forms during, or just after, a major multicycle low has been completed and confirmed. 2. Money flow analysis reveals that accumulation is underway as the pattern forms. 3. Volatility gets more tame prior to a breakout, with prices usually tightening into an obvious consolidation range. Once these three dynamics are evident on a daily price chart, all that's needed to confirm that the "smart money" is indeed ready to mark the stock's price up are these three events: A. Price surges up and out of the narrow range, low volatility congestion zone. 2. The daily volume on the break higher should be at least double (more is even better) than the average daily volume figure of the prior 50 trading days. 3. The daily range of the breakout bar should also be two to three times the average true range of the prior 50 trading sessions. In this example with KWK, all of the six listed criteria have been met, meaning that this new breakout has a very good chance — excellent, actually — of having significant bullish follow through in the days and weeks ahead. The broad market, not to mention KWK's parent industry group (oil/gas exploration and production) will also play a part in how far KWK's breakout will carry, but the stock's industry group has above average earnings growth potential heading into 2014, so that should bode well for KWK's prospects for the foreseeable future. |

|
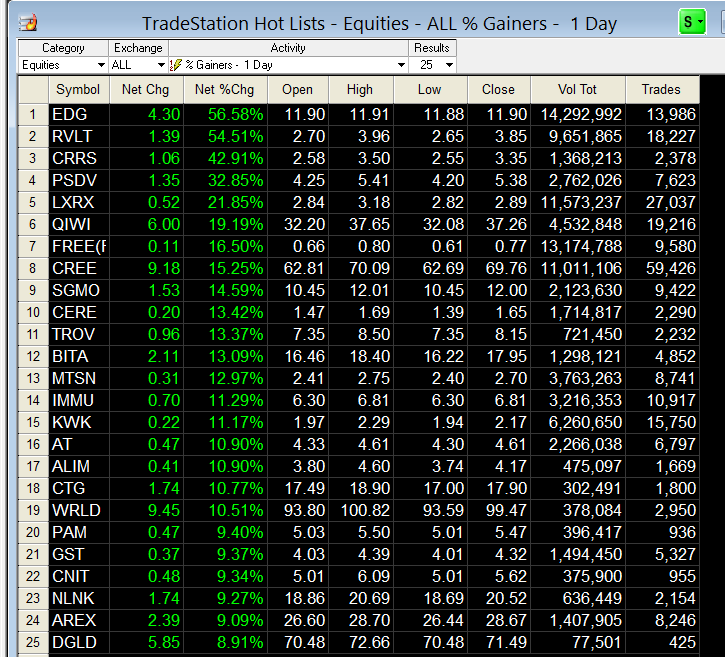
| Figure 2. There are some big daily gainers every day in the US stock market, but not all of them are worthy of a savvy trader/investor's consideration. You need a structured way to evaluate the stock's key fundamentals and technicals. |
| Graphic provided by: TradeStation. |
| Graphic provided by: TradeStation Radar Screen Hot Lists. |
| |
| Note that there was a bit of intraday profit-taking on Tuesday's (October 1, 2013) breakout — as "disbelievers" decided to cash in quick instead of waiting for more potential gains. The intraday high was 2.29, so if you see KWK break 2.30 on above average volume within the next 1-5 trading sessions, that will be a strong follow-through signal. If you're a long-term trader, you may just want to establish a modest position on such a continuation, using a 21 to 34-day moving average to trail the position; on future pullbacks to support, you could also consider 'add-on' positions, in hopes of bigger gains. You could also use a wide 3 * ATR 10 volatility trailing stop to manage the position, the choice is yours. You initial stop should be set no lower than 1.85. Swing traders can use the same buy stop entry of 2.30, setting their sights on the 2.64 and 2.86 resistance levels as profit-taking targets; such traders might want to use a three-bar trailing stop of the daily lows to manage these shorter-term positions in KWK. Finally, as bullish as this setup appears, remember to risk no more than 1-2% of your account value on the trade and to diversify your stock portfolio over a wide variety of industry groups. Trade wisely until we meet here again. |
Freelance financial markets writer and online publisher of the Trendzetterz.com S&P 500 Weekly Forecast service.
| Title: | Market consultant and writer |
| Company: | Trendzetterz |
| Address: | 81 Hickory Hollow Drive |
| Crossville, TN 38555 | |
| Phone # for sales: | 904-303-4814 |
| Website: | trendzetterz.com |
| E-mail address: | support@trendzetterz.com |
Traders' Resource Links | |
| Trendzetterz has not added any product or service information to TRADERS' RESOURCE. | |
Click here for more information about our publications!
Comments

Request Information From Our Sponsors
- StockCharts.com, Inc.
- Candle Patterns
- Candlestick Charting Explained
- Intermarket Technical Analysis
- John Murphy on Chart Analysis
- John Murphy's Chart Pattern Recognition
- John Murphy's Market Message
- MurphyExplainsMarketAnalysis-Intermarket Analysis
- MurphyExplainsMarketAnalysis-Visual Analysis
- StockCharts.com
- Technical Analysis of the Financial Markets
- The Visual Investor
- VectorVest, Inc.
- Executive Premier Workshop
- One-Day Options Course
- OptionsPro
- Retirement Income Workshop
- Sure-Fire Trading Systems (VectorVest, Inc.)
- Trading as a Business Workshop
- VectorVest 7 EOD
- VectorVest 7 RealTime/IntraDay
- VectorVest AutoTester
- VectorVest Educational Services
- VectorVest OnLine
- VectorVest Options Analyzer
- VectorVest ProGraphics v6.0
- VectorVest ProTrader 7
- VectorVest RealTime Derby Tool
- VectorVest Simulator
- VectorVest Variator
- VectorVest Watchdog
