HOT TOPICS LIST
- MACD
- Fibonacci
- RSI
- Gann
- ADXR
- Stochastics
- Volume
- Triangles
- Futures
- Cycles
- Volatility
- ZIGZAG
- MESA
- Retracement
- Aroon
INDICATORS LIST
LIST OF TOPICS
PRINT THIS ARTICLE
by Koos van der Merwe
No matter who the company is, when a head and shoulders formation starts developing, caution prevails.
Position: Sell
Koos van der Merwe
Has been a technical analyst since 1969, and has worked as a futures and options trader with First Financial Futures in Johannesburg, South Africa.
PRINT THIS ARTICLE
HEAD & SHOULDERS
Mmm... A Head and Shoulders Formation?
09/30/13 03:05:26 PMby Koos van der Merwe
No matter who the company is, when a head and shoulders formation starts developing, caution prevails.
Position: Sell
| When one thinks of JP Morgan Chase & Co, one thinks about Jamie Dimon, Chief Executive Officer and President. One also thinks of the "London Whale" trades, where the company lost $6.2 billion dollars on derivative bets, one of many missteps that has drawn regulatory scrutiny. The latest unpleasant news for the company, reported by Reuters on September 25th, is that the company is in talks with government officials to settle federal and state mortgage probes for $11 billion. The bank, the biggest in the United States by assets, believes that although the losses incurred are painful, they are manageable. With a 2102 net income of $21.3 billion, and with analysts estimating higher profits for 2013, would you be an investor in the company? |

|
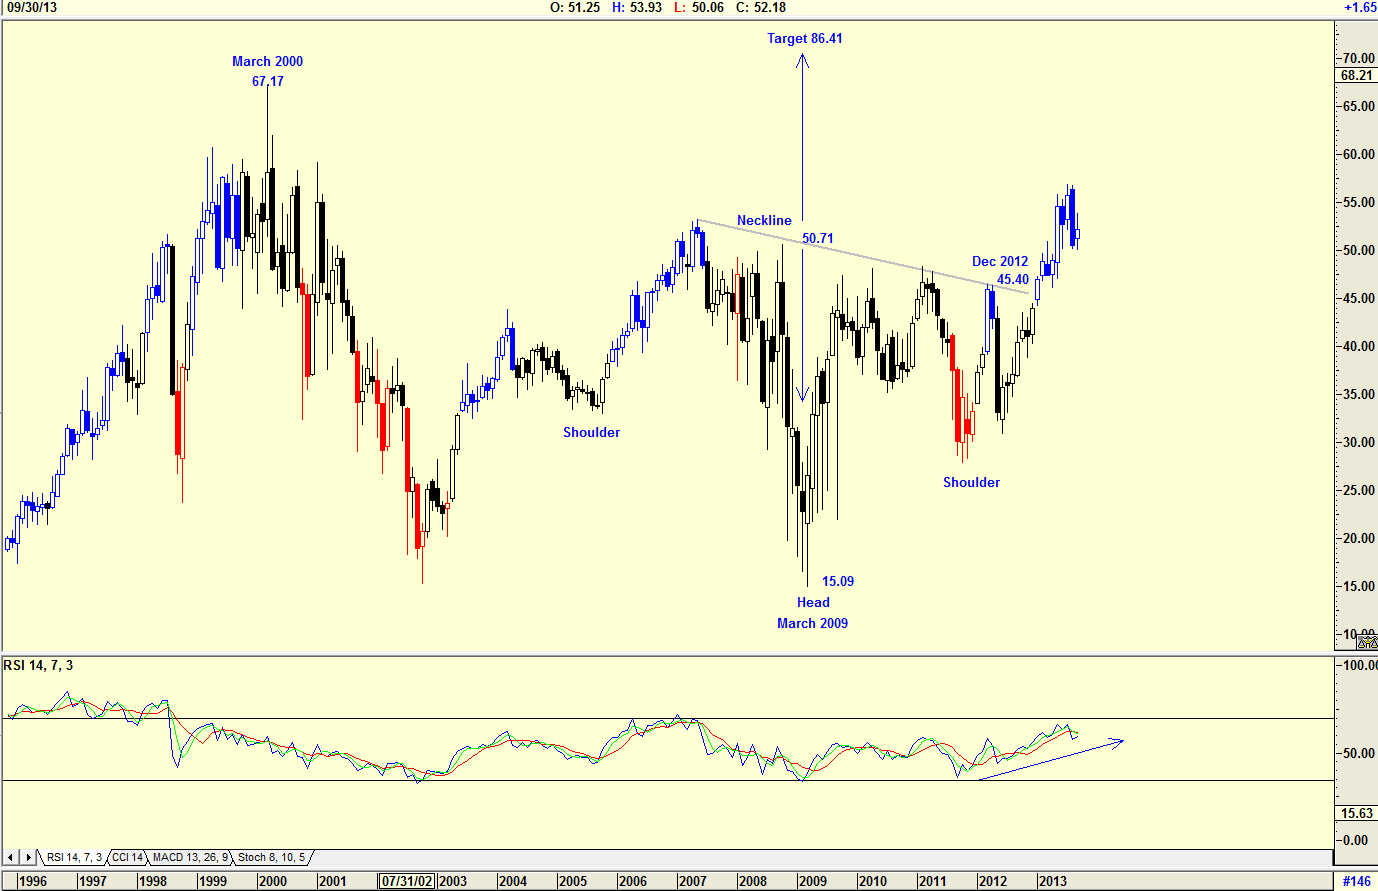
| Figure 1. Monthly chart showing an inverse head and shoulder formation. |
| Graphic provided by: AdvancedGET. |
| |
| The chart in Figure 1 is a monthly chart of JP Morgan Chase. The chart shows how the price fell from a high of $67.17 in March 2000 to a low of $15.09 by March 2009. The chart also suggests that an inverted head and shoulders formation is developing. Should this be genuine, then the target suggested is $86.41. (50.71-15.09=35.62+50.71=86.41) The chart does show that the neckline was broken when the price rose above $45.40 in December 2012. With the RSI indicator trending upwards, the possibility that the price could reach the target is gaining acceptance for a a long-term trend. |

|
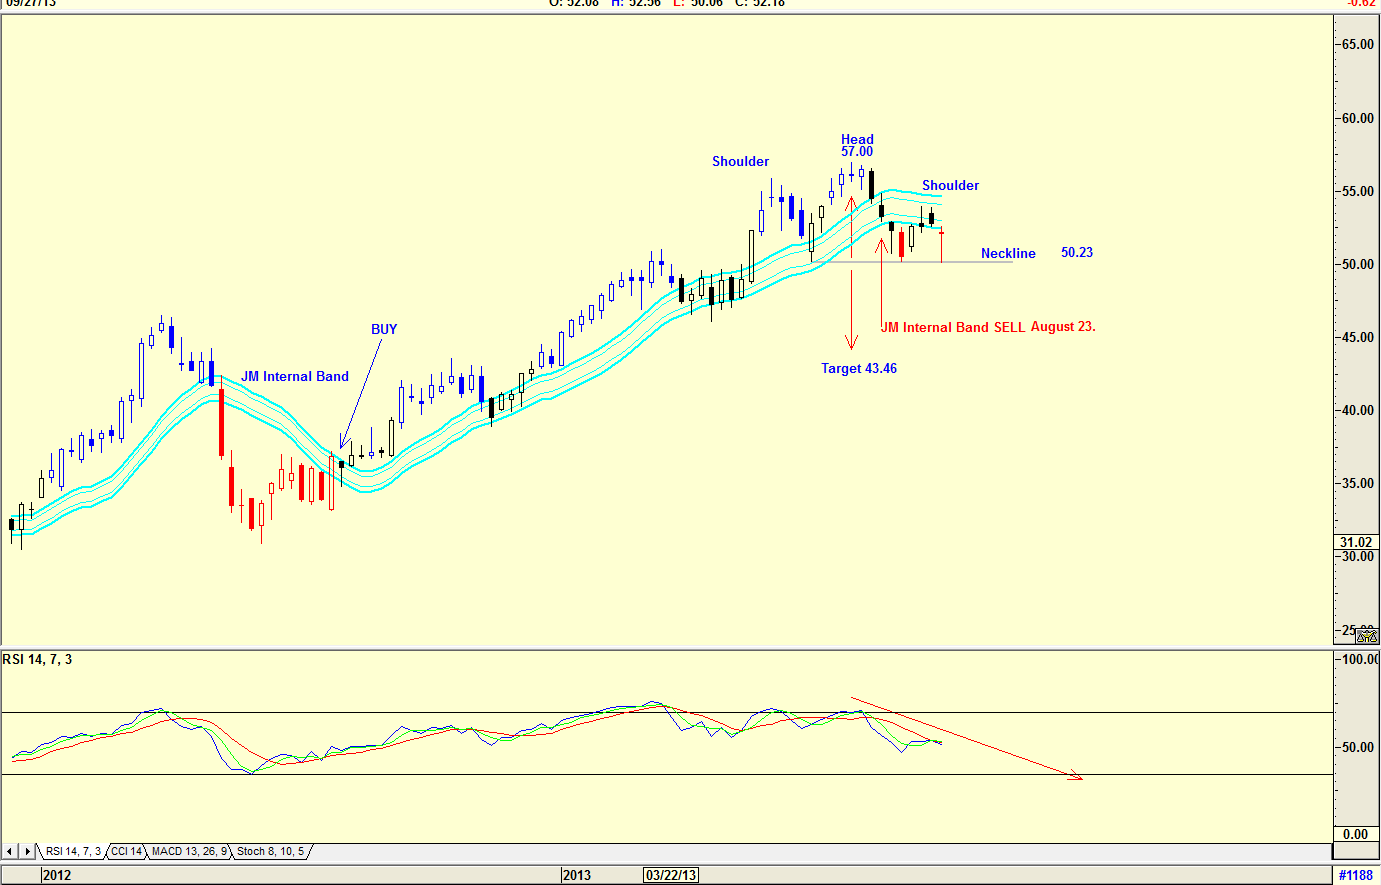
| Figure 2. Weekly chart showing head and shoulder formation with target. |
| Graphic provided by: AdvancedGET. |
| |
| The chart in Figure 2 is a weekly chart, and shows a possible head and shoulders formation suggesting that the share price could fall to $43.46. (57.00-50.23 = 6.77. 50.23-6.77=43.46). With an RSI trending down, this target looks very possible, however the price must first break below the neckline at $50.23 for this to happen. Do note that a JM Internal Band sell signal was given on August 23rd. The JM Internal Band is a 15 period simple moving average offset by 2% positive and 2% negative. |

|
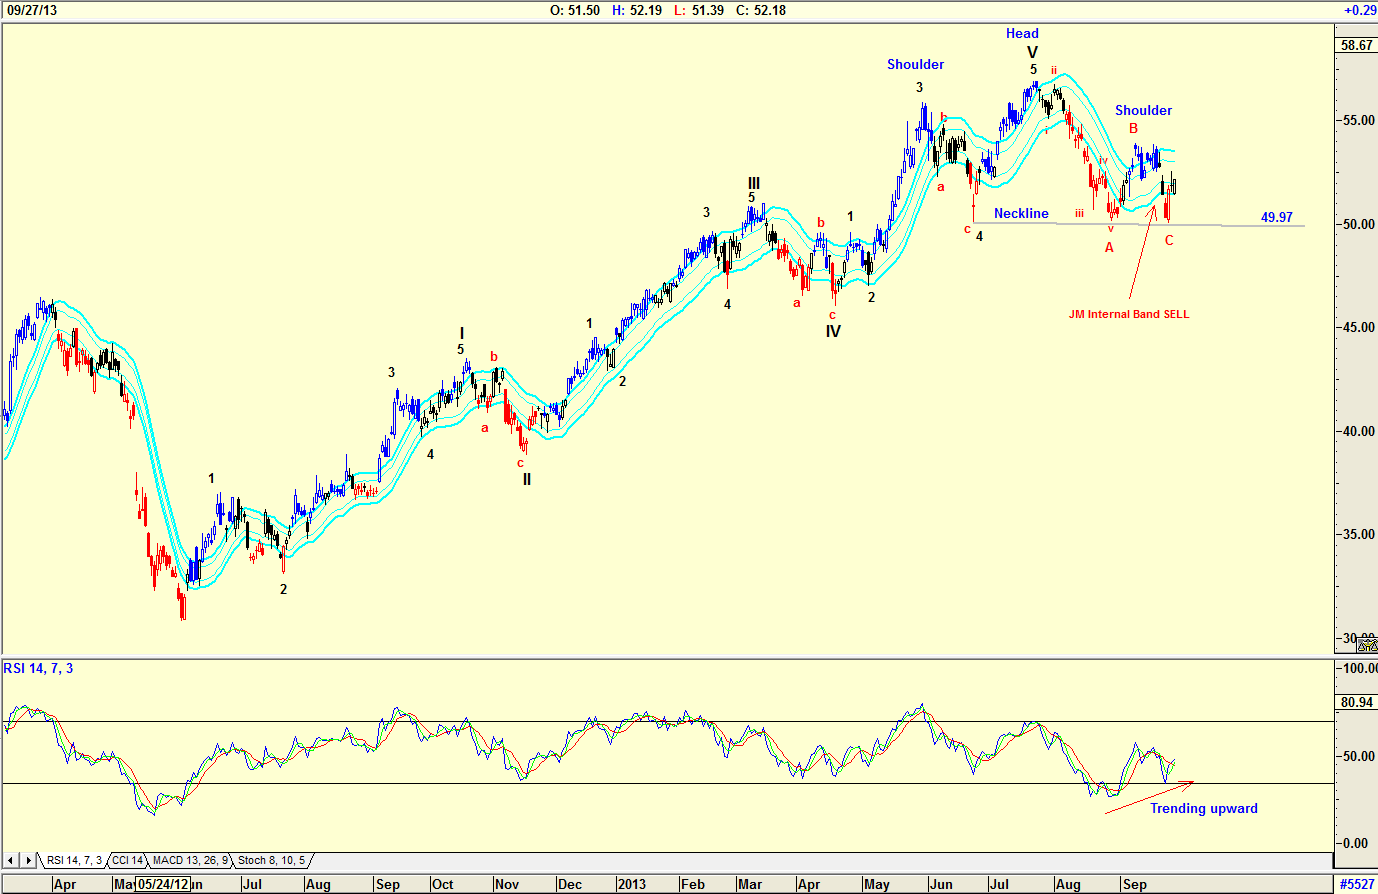
| Figure 3. Daily chart showing JM Internal Band and head and shoulder formation. |
| Graphic provided by: AdvancedGET. |
| |
| The chart in Figure 3 is a daily chart, and shows an Elliott wave count suggesting that a WAVE V has been completed, and that the price appears to have completed an ABC correction with the C-Wave testing the neckline at $49.97 of the head and shoulders formation shown in Figure 2. The JM Internal Band has given a SELL signal. However, the RSI appears to be trending upwards, casting doubt. |

|
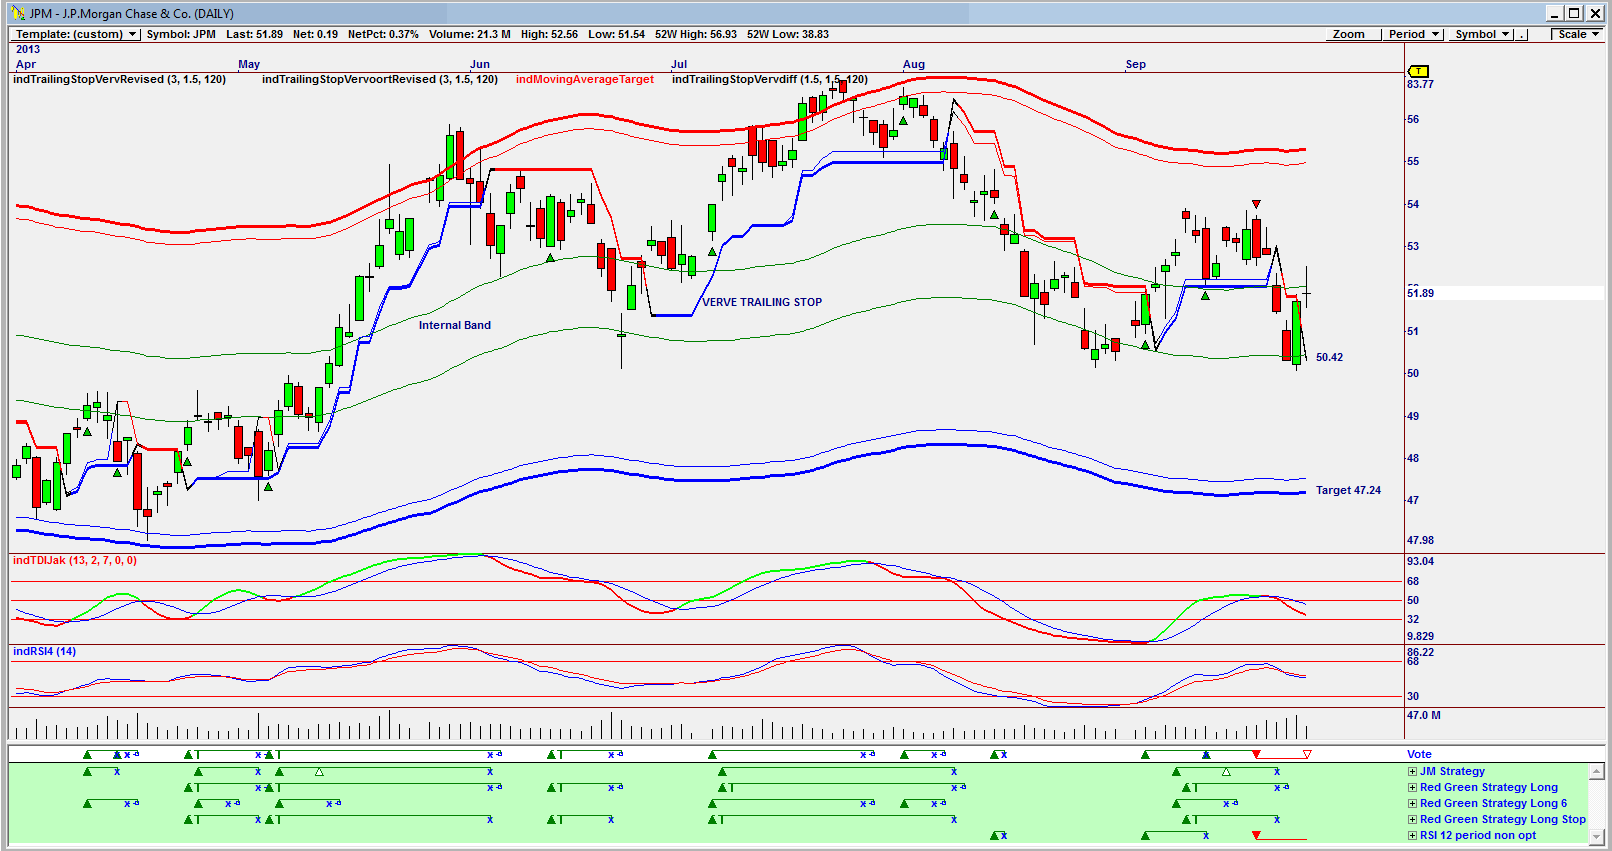
| Figure 4. Omnitrader daily chart showing Vote line SELL signal. |
| Graphic provided by: Omnitrader.. |
| |
| My final chart in Figure 4 is an Omnitrader chart with the VOTE line suggesting a SELL signal. The VOTE line signal is a summation of the strategies shown in green below the VOTE line. The target suggested by the lower band is $47.24 but this target can move upwards or downwards with time. Both the RSI and the TDIJak indicators are suggesting sell. Do note how often the price has found resistance and support on the lower internal band. This does suggest that the price could move sideways playing with the lower band at $50.42 until a BUY signal is given by the VOTE line. I would not be a buyer of JP Morgan until Jamie Dimon settles all the banks problems. The maxim, "when in doubt stay out" is always in my mind, however the charts are suggesting that the bank is handling its problems successfully. The question of course is, will Jamie Dimon, under whose management these problems occurred, be replaced? JPM is a share that is on my watch list. |
Has been a technical analyst since 1969, and has worked as a futures and options trader with First Financial Futures in Johannesburg, South Africa.
| Address: | 3256 West 24th Ave |
| Vancouver, BC | |
| Phone # for sales: | 6042634214 |
| E-mail address: | petroosp@gmail.com |
Click here for more information about our publications!
PRINT THIS ARTICLE

Request Information From Our Sponsors
- StockCharts.com, Inc.
- Candle Patterns
- Candlestick Charting Explained
- Intermarket Technical Analysis
- John Murphy on Chart Analysis
- John Murphy's Chart Pattern Recognition
- John Murphy's Market Message
- MurphyExplainsMarketAnalysis-Intermarket Analysis
- MurphyExplainsMarketAnalysis-Visual Analysis
- StockCharts.com
- Technical Analysis of the Financial Markets
- The Visual Investor
- VectorVest, Inc.
- Executive Premier Workshop
- One-Day Options Course
- OptionsPro
- Retirement Income Workshop
- Sure-Fire Trading Systems (VectorVest, Inc.)
- Trading as a Business Workshop
- VectorVest 7 EOD
- VectorVest 7 RealTime/IntraDay
- VectorVest AutoTester
- VectorVest Educational Services
- VectorVest OnLine
- VectorVest Options Analyzer
- VectorVest ProGraphics v6.0
- VectorVest ProTrader 7
- VectorVest RealTime Derby Tool
- VectorVest Simulator
- VectorVest Variator
- VectorVest Watchdog
