

HOT TOPICS LIST
- MACD
- Fibonacci
- RSI
- Gann
- ADXR
- Stochastics
- Volume
- Triangles
- Futures
- Cycles
- Volatility
- ZIGZAG
- MESA
- Retracement
- Aroon
INDICATORS LIST
LIST OF TOPICS
PRINT THIS ARTICLE
by Donald W. Pendergast, Jr.
Crude oil's technicals and seasonality trends suggest there may still be more downside as the fall season progresses.
Position: N/A
Donald W. Pendergast, Jr.
Freelance financial markets writer and online publisher of the Trendzetterz.com S&P 500 Weekly Forecast service.
PRINT THIS ARTICLE
MACD
Crude Oil: More Downside this Fall Season?
09/30/13 02:42:24 PMby Donald W. Pendergast, Jr.
Crude oil's technicals and seasonality trends suggest there may still be more downside as the fall season progresses.
Position: N/A
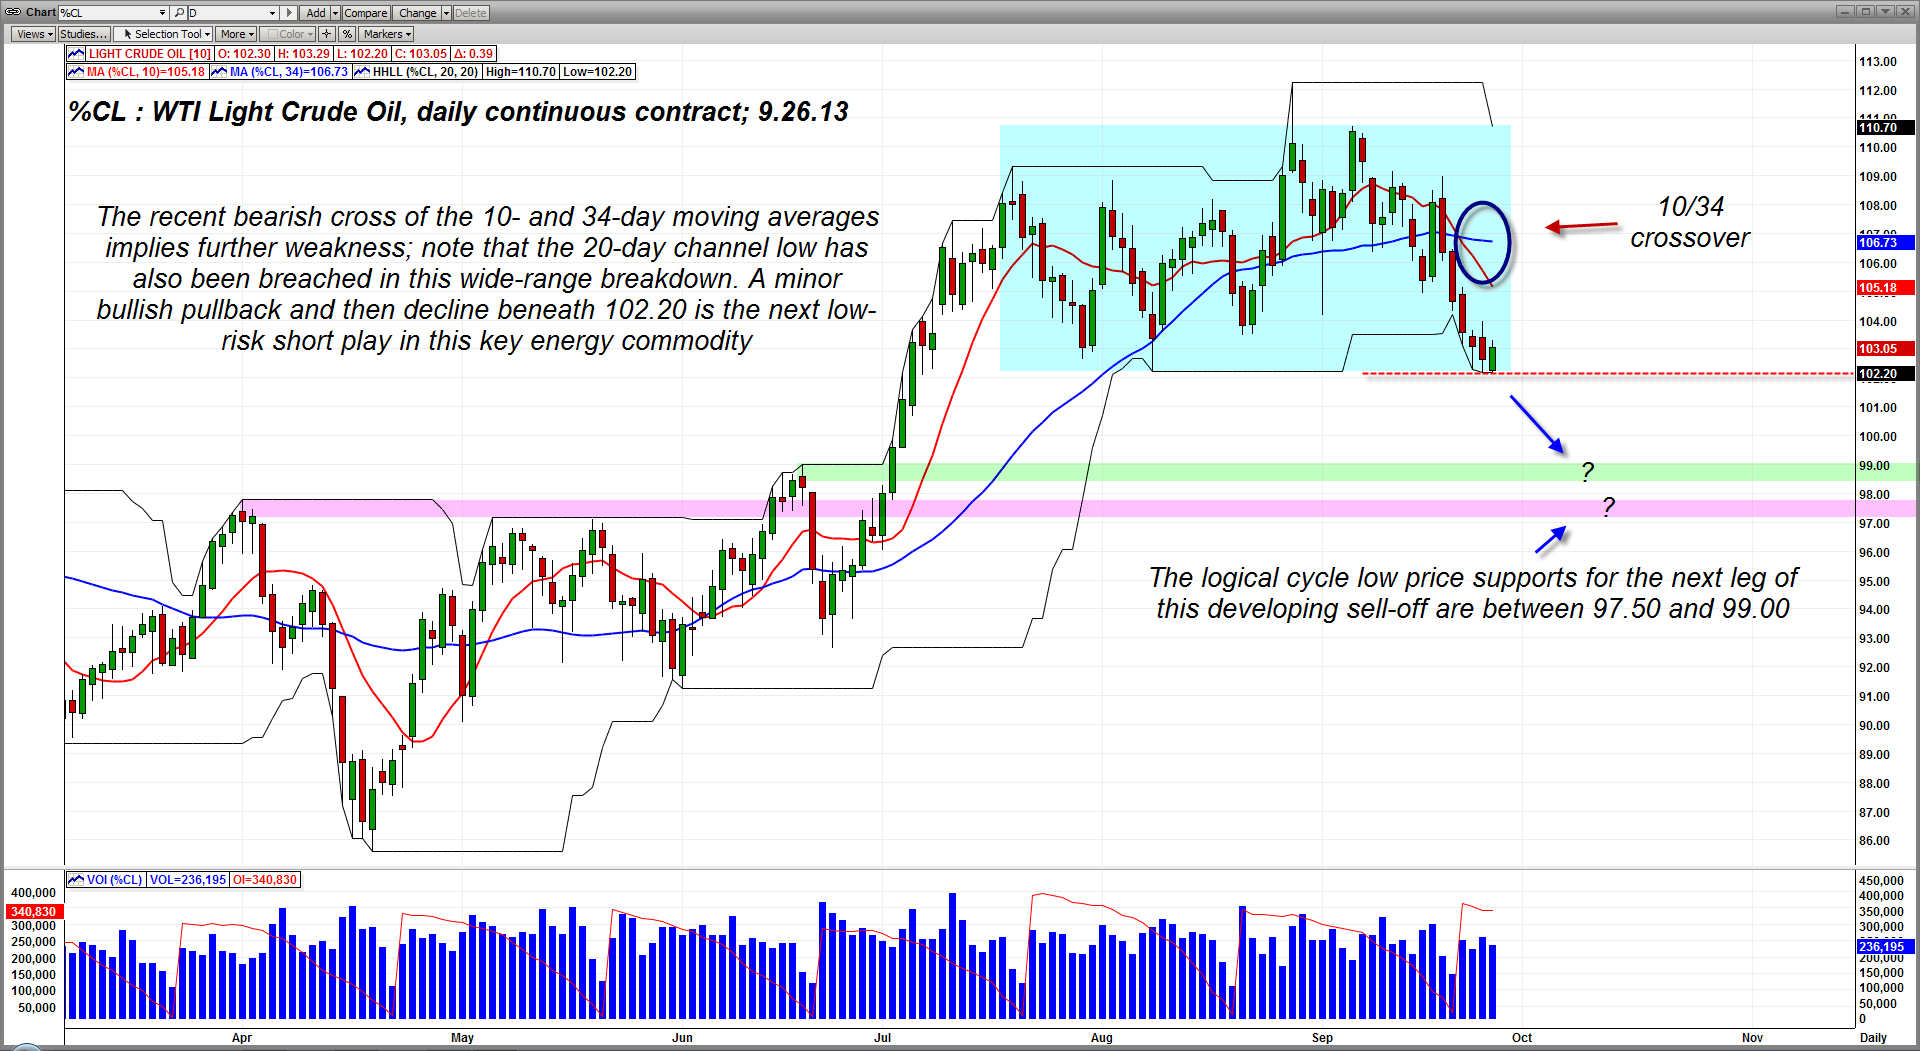
| West Texas Intermediate (WTI) crude oil prices rallied strongly from mid-April until late August 2013, tacking on gains as much as 31% during the rally. A second attempt at new yearly highs failed in early September 2013, and ever since then the bears have kept a tight lid on this energy commodity's upward momentum. And now that some key technicals have confirmed that a multicycle high is in place, there are the bearish seasonality factors to consider as well. Here's a look now at the developing near-term downtrend in WTI crude oil. |
|
| Figure 1. A break back down below 102.20 may be the signal that drives the price of WTI crude oil back below 100.00; note the twin support zones between 97.50 and 99.00. |
| Graphic provided by: FutureSource.com. |
| |
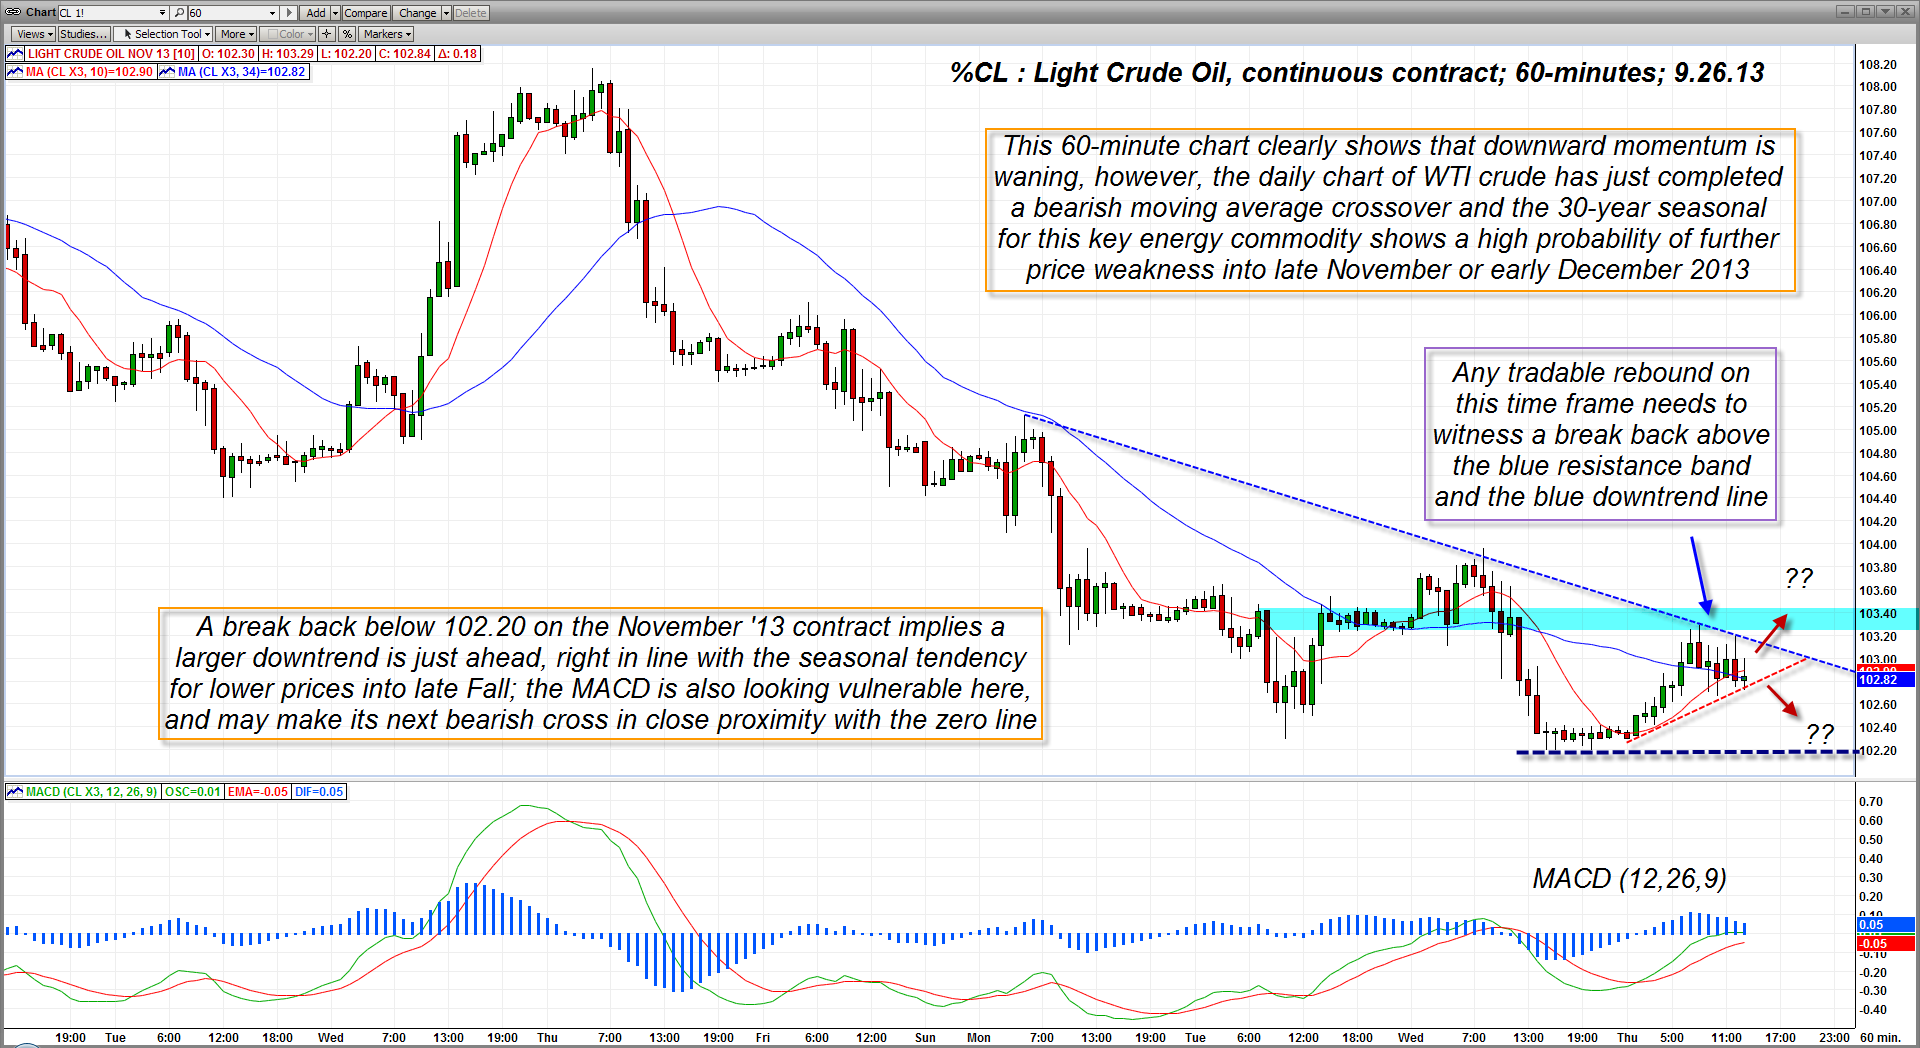
| Energy bulls enjoyed a relatively prosperous spring/summer trading season in WTI crude oil; based on the continuous contract prices, crude rallied 31% from its April 18th 2013 low to its August 28, 2013 multicycle high. That run — from 85.61 to 112.14 — had several smaller rallies on either side of the mammoth, month long bull run made between mid-June and mid-July 2013. Naturally, after a major run like that, the bulls are always pounding the table, looking for even higher prices. However, once the situation in Syria began to quiet down, the real pros who dominate the crude oil market began trading according to the price road map implied by crude's multi-decade seasonality charts — most of which strongly suggest that crude oil will continue to trend lower into late Fall 2013, barring unusually volatile weather, economic or geopolitical events. The seasonality chart (not shown) for crude oil makes it very clear that the high price for any given year typically occurs early in the 4th quarter, and this year, the pattern is working out very close to the historical seasonality record. In terms of daily chart technicals, check this out: 1. The 10- and 34-day simple moving averages (SMA) have just completed a bearish cross to the downside. 2. The price of crude oil has also broken below its 20-day price channel (Turtles alert!) Additionally, the 60-minute chart also shows a very weak round of price action; for any kind of tradable swing rally, both the blue resistance band and blue downtrend line need to be violated with a high volume bullish breakout bar if this downtrend is destined to end soon. And that looks very unlikely at this juncture, especially with pro traders watching the bearish seasonality charts. Note also that the MACD on the 60-minute chart is strengthening but that it is still below the zero line. In this case, further weakness and a decline beneath the latest support of 102.20 will result in an MACD crossover close to the zero line, and those kind of moves often morph into solid trend following phases. So, there are plenty of bearish intraday and daily chart factors to be aware of here. |
|
| Figure 2.: This 60-minute chart of WTI crude oil reveals that there is a strong resistance band (blue shaded area) that must be soon overcome if this major correction is to end soon. |
| Graphic provided by: FutureSource.com. |
| |
| Playing crude oil here is simple and straightforward: 1. On an intraday decline beneath 102.20, go short using the 60-minute chart as your trading time frame. 2. Place your initial stop above the high of the price bar prior to the breakdown bar, making sure your account risk is no more than 2%. 3. Once in the trade, use the 10-period moving average on the 60-minute chart as your trailing stop; an hourly close above the average is your signal to lock in gains, depending on how the trade actually goes. If you have a small account, you may wish to trade min-crude oil contracts, depending on your level of experience and psychological fortitude. But even if you can't afford to trade oil futures, at least take some comfort in the fact that the monthly gasoline for your SUV, pickup truck or family wheels is likely going to be shrinking for the next couple of months. Trade wisely until we meet here again. |
Freelance financial markets writer and online publisher of the Trendzetterz.com S&P 500 Weekly Forecast service.
| Title: | Market consultant and writer |
| Company: | Trendzetterz |
| Address: | 81 Hickory Hollow Drive |
| Crossville, TN 38555 | |
| Phone # for sales: | 904-303-4814 |
| Website: | trendzetterz.com |
| E-mail address: | support@trendzetterz.com |
Traders' Resource Links | |
| Trendzetterz has not added any product or service information to TRADERS' RESOURCE. | |
Click here for more information about our publications!
Comments

Request Information From Our Sponsors
- StockCharts.com, Inc.
- Candle Patterns
- Candlestick Charting Explained
- Intermarket Technical Analysis
- John Murphy on Chart Analysis
- John Murphy's Chart Pattern Recognition
- John Murphy's Market Message
- MurphyExplainsMarketAnalysis-Intermarket Analysis
- MurphyExplainsMarketAnalysis-Visual Analysis
- StockCharts.com
- Technical Analysis of the Financial Markets
- The Visual Investor
- VectorVest, Inc.
- Executive Premier Workshop
- One-Day Options Course
- OptionsPro
- Retirement Income Workshop
- Sure-Fire Trading Systems (VectorVest, Inc.)
- Trading as a Business Workshop
- VectorVest 7 EOD
- VectorVest 7 RealTime/IntraDay
- VectorVest AutoTester
- VectorVest Educational Services
- VectorVest OnLine
- VectorVest Options Analyzer
- VectorVest ProGraphics v6.0
- VectorVest ProTrader 7
- VectorVest RealTime Derby Tool
- VectorVest Simulator
- VectorVest Variator
- VectorVest Watchdog