

HOT TOPICS LIST
- MACD
- Fibonacci
- RSI
- Gann
- ADXR
- Stochastics
- Volume
- Triangles
- Futures
- Cycles
- Volatility
- ZIGZAG
- MESA
- Retracement
- Aroon
INDICATORS LIST
LIST OF TOPICS
PRINT THIS ARTICLE
by Donald W. Pendergast, Jr.
Shares of Gain Capital Holdings are moving up past a key mean-reversion indicator, one that suggests some profit-taking will soon manifest.
Position: N/A
Donald W. Pendergast, Jr.
Freelance financial markets writer and online publisher of the Trendzetterz.com S&P 500 Weekly Forecast service.
PRINT THIS ARTICLE
KELTNER CHANNELS
GCAP Getting Toppy?
09/26/13 05:07:08 PMby Donald W. Pendergast, Jr.
Shares of Gain Capital Holdings are moving up past a key mean-reversion indicator, one that suggests some profit-taking will soon manifest.
Position: N/A
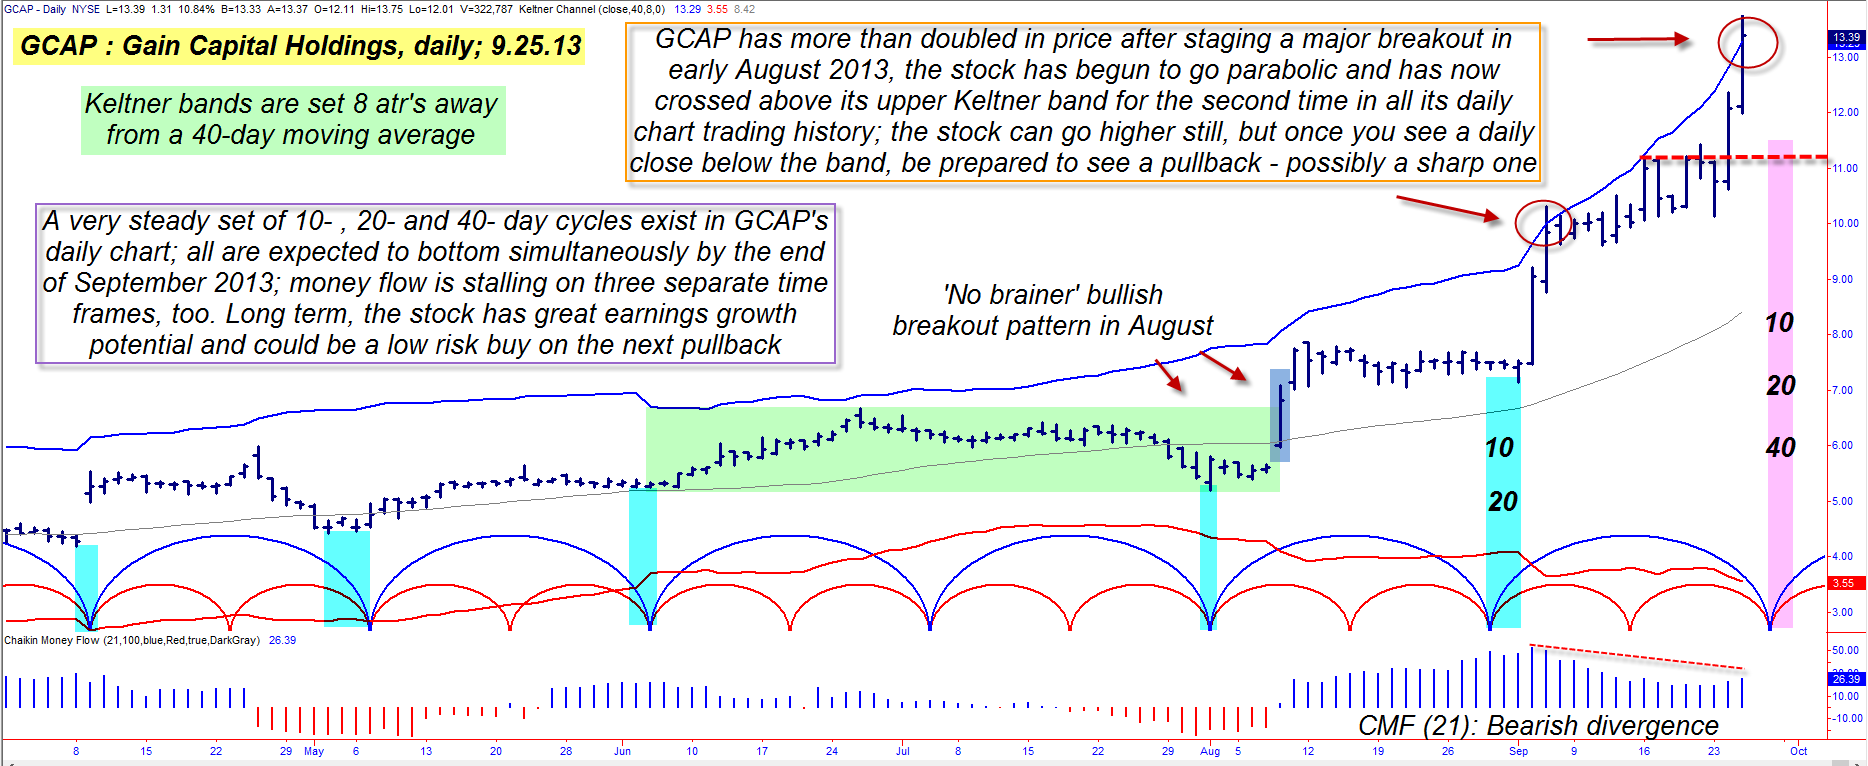
| Shares of Gain Capital Holdings (GCAP) keep surging higher after staging a major range breakout in early August 2013; the latest move higher is stretching beyond statistical norms by a wide margin, however. Here's a closer look at this very interesting technical dynamic on GCAP's daily chart (Figure 1). |
|
| Figure 1. It's never possible for anyone to call the exact "top" in a market — save the infrequent lucky guess — GCAP's time cycle, money flow and Keltner band configuration suggests that a correction might be on the way soon. |
| Graphic provided by: TradeStation. |
| |
| Buying or short-selling stocks and exchange-traded funds (ETFs) on pullbacks to support areas can be an effective way to trade the markets, whether it is on a weekly, daily, or intraday time frame; however, there are times when buying or selling breakouts from consolidation patterns also makes for a terrific trading technique. In the daily chart of GCAP in Figure 1, witness the powerful, wide-range daily breakout bar of August 3, 2013 (purple shading) up and out of the green consolidation, low-volatility trading range that lasted for nearly nine weeks; this breakout bar was the "game changer" that alerted savvy traders that GCAP had its sights set on higher valuations. The stock went on to stage several more breakouts, with one of them (on September 5, 2013) piercing above the upper Keltner band before closing back inside. Just three weeks later, GCAP surged higher again, this time making another run above the band — and at a time when the stock may be in "parabolic" trend mode. The Keltners are set at eight average true ranges (ATRs) away from a 40-day simple moving average (SMA) and do a good job of identifying stocks/ETFs/commodities that have been pushed to statistical extremes, the kind typically seen before pullbacks and/or trend reversals. Also of note as GCAP soars to extremes is that the short-term Chaikin Money flow histogram (CMF)(21) is manifesting a clear bearish divergence with price action on the chart. This is truly a time to be cautious about going long this stock, because the probabilities of a near-term pullback/correction are way above average, given the evidence revealed by this pair of useful volume/volatility technical studies. But wait — there's more! GCAP's 10-, 20- and 40-day price cycles are all due to bottom together by the end of September 2013; the 40-day may be the primary driver of any corrective move lower, and if it is, the pullback could be sharp. The $11.50 area could be a possible pullback low area in which to look for another low-risk entry point (red dashed line). |
|
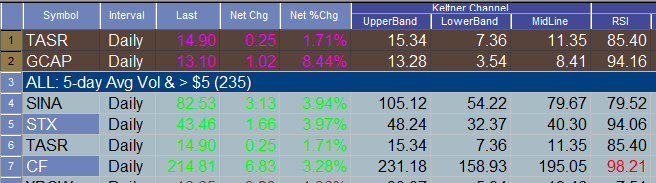
| Figure 2. GCAP and TASR look vulnerable to near-term profit taking over the next seven to 10 days. |
| Graphic provided by: TradeStation. |
| Graphic provided by: TradeStation Radar Screen. |
| |
| The major US stock indexes are also an track for multicycle lows (with most large cap and mid-cap stock displaying similar patterns) between now and early October 2013, so it will be interesting to see what shakes out in the markets over the next week or so. As far as GCAP goes, the probabilities are heavily in favor of a decline, so if you are long this stock, be sure to have an exit and/or put option strategy in place. By the way a few other stocks also look vulnerable to profit-taking (Figure 2), including TASR, FB and UBNT. Trade wisely until we meet here again, being very conservative if attempting to go long in the next seven to 10 days. |
Freelance financial markets writer and online publisher of the Trendzetterz.com S&P 500 Weekly Forecast service.
| Title: | Market consultant and writer |
| Company: | Trendzetterz |
| Address: | 81 Hickory Hollow Drive |
| Crossville, TN 38555 | |
| Phone # for sales: | 904-303-4814 |
| Website: | trendzetterz.com |
| E-mail address: | support@trendzetterz.com |
Traders' Resource Links | |
| Trendzetterz has not added any product or service information to TRADERS' RESOURCE. | |
Click here for more information about our publications!
PRINT THIS ARTICLE

Request Information From Our Sponsors
- VectorVest, Inc.
- Executive Premier Workshop
- One-Day Options Course
- OptionsPro
- Retirement Income Workshop
- Sure-Fire Trading Systems (VectorVest, Inc.)
- Trading as a Business Workshop
- VectorVest 7 EOD
- VectorVest 7 RealTime/IntraDay
- VectorVest AutoTester
- VectorVest Educational Services
- VectorVest OnLine
- VectorVest Options Analyzer
- VectorVest ProGraphics v6.0
- VectorVest ProTrader 7
- VectorVest RealTime Derby Tool
- VectorVest Simulator
- VectorVest Variator
- VectorVest Watchdog
- StockCharts.com, Inc.
- Candle Patterns
- Candlestick Charting Explained
- Intermarket Technical Analysis
- John Murphy on Chart Analysis
- John Murphy's Chart Pattern Recognition
- John Murphy's Market Message
- MurphyExplainsMarketAnalysis-Intermarket Analysis
- MurphyExplainsMarketAnalysis-Visual Analysis
- StockCharts.com
- Technical Analysis of the Financial Markets
- The Visual Investor