HOT TOPICS LIST
- MACD
- Fibonacci
- RSI
- Gann
- ADXR
- Stochastics
- Volume
- Triangles
- Futures
- Cycles
- Volatility
- ZIGZAG
- MESA
- Retracement
- Aroon
INDICATORS LIST
LIST OF TOPICS
PRINT THIS ARTICLE
by Gary Grosschadl
Since peaking in the mid-twenties, this stock has been free falling to multi-year lows. Now it is trying to hold its previous low -- a candlestick "bottom hammer" -- but will it stick ?
Position: N/A
Gary Grosschadl
Independent Canadian equities trader and technical analyst based in Peterborough
Ontario, Canada.
PRINT THIS ARTICLE
CHART ANALYSIS
Are We Seeing a Bottom Hammer?
09/25/02 03:27:34 PMby Gary Grosschadl
Since peaking in the mid-twenties, this stock has been free falling to multi-year lows. Now it is trying to hold its previous low -- a candlestick "bottom hammer" -- but will it stick ?
Position: N/A
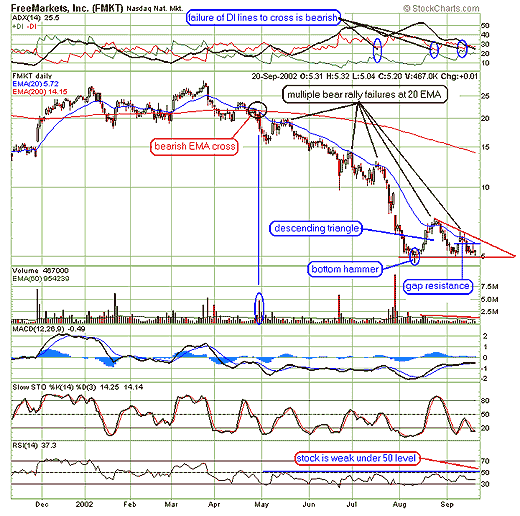
| Looking back to May 2002, we can see that FreeMarket's (FMKT) vicious decline began in earnest via the 20-day EMA crossing below the 200-day EMA. Note the volume spike that emphasized a turning point. Typical of a serious downtrend is the pattern of multiple failures at the overhead resistance from the 20-day EMA line. This is likely to remain a formidable resistance line as it also corresponds to the previous gap resistance line shown on the chart at the $5.70 area. Also note that, except for the occasional bear rally, the directional movement indicator at the top of the chart shows that sellers rule as long as -DI remains above +DI. |

|
| Graphic provided by: stockcharts.com. |
| |
| A strong clue that support may fail at the $5 level is the bearish descending triangle formation. Volume correctly contracts as the triangle develops. The target price, should this pattern conclude to the downside, is found by measuring the widest distance of the pattern and subtracting it from the resistance breakout. This would be a drop below $5 and suggests a possible move down to $3. A surprise move up past the upper trendline around $6 would invalidate the bearish intent of this formation. A move below $5 would be attractive to short sellers. |
Independent Canadian equities trader and technical analyst based in Peterborough
Ontario, Canada.
| Website: | www.whatsonsale.ca/financial.html |
| E-mail address: | gwg7@sympatico.ca |
Click here for more information about our publications!
PRINT THIS ARTICLE

Request Information From Our Sponsors
- VectorVest, Inc.
- Executive Premier Workshop
- One-Day Options Course
- OptionsPro
- Retirement Income Workshop
- Sure-Fire Trading Systems (VectorVest, Inc.)
- Trading as a Business Workshop
- VectorVest 7 EOD
- VectorVest 7 RealTime/IntraDay
- VectorVest AutoTester
- VectorVest Educational Services
- VectorVest OnLine
- VectorVest Options Analyzer
- VectorVest ProGraphics v6.0
- VectorVest ProTrader 7
- VectorVest RealTime Derby Tool
- VectorVest Simulator
- VectorVest Variator
- VectorVest Watchdog
- StockCharts.com, Inc.
- Candle Patterns
- Candlestick Charting Explained
- Intermarket Technical Analysis
- John Murphy on Chart Analysis
- John Murphy's Chart Pattern Recognition
- John Murphy's Market Message
- MurphyExplainsMarketAnalysis-Intermarket Analysis
- MurphyExplainsMarketAnalysis-Visual Analysis
- StockCharts.com
- Technical Analysis of the Financial Markets
- The Visual Investor
