HOT TOPICS LIST
- MACD
- Fibonacci
- RSI
- Gann
- ADXR
- Stochastics
- Volume
- Triangles
- Futures
- Cycles
- Volatility
- ZIGZAG
- MESA
- Retracement
- Aroon
INDICATORS LIST
LIST OF TOPICS
PRINT THIS ARTICLE
by Donald W. Pendergast, Jr.
Despite a recent bit of turbulence, the S&P 500 index appears to be holding up well, and may soon be expected to make a 10- and 20-day cycle low.
Position: N/A
Donald W. Pendergast, Jr.
Freelance financial markets writer and online publisher of the Trendzetterz.com S&P 500 Weekly Forecast service.
PRINT THIS ARTICLE
CYCLES
SPY: Approaching Minor Cycle Turn?
09/25/13 04:01:31 PMby Donald W. Pendergast, Jr.
Despite a recent bit of turbulence, the S&P 500 index appears to be holding up well, and may soon be expected to make a 10- and 20-day cycle low.
Position: N/A
| Last week's Fed announcement induced traders and investors to push the S&P 500 (.SPX) and Dow Industrials (.DJIA) to all-time record closes; whether this was the final "hurrah" of the incredible 4 1/2 year bull market that launched in March 2009 or not, the latest surge to new highs has now helped set up a move lower — one that will be a key support/resistance test — into a combined 10- and 20-day cycle low, one that is due by the end of this trading week. Here's a look at this interesting setup, one that could offer short-term traders a low-risk, modest reward long trade entry soon. |

|
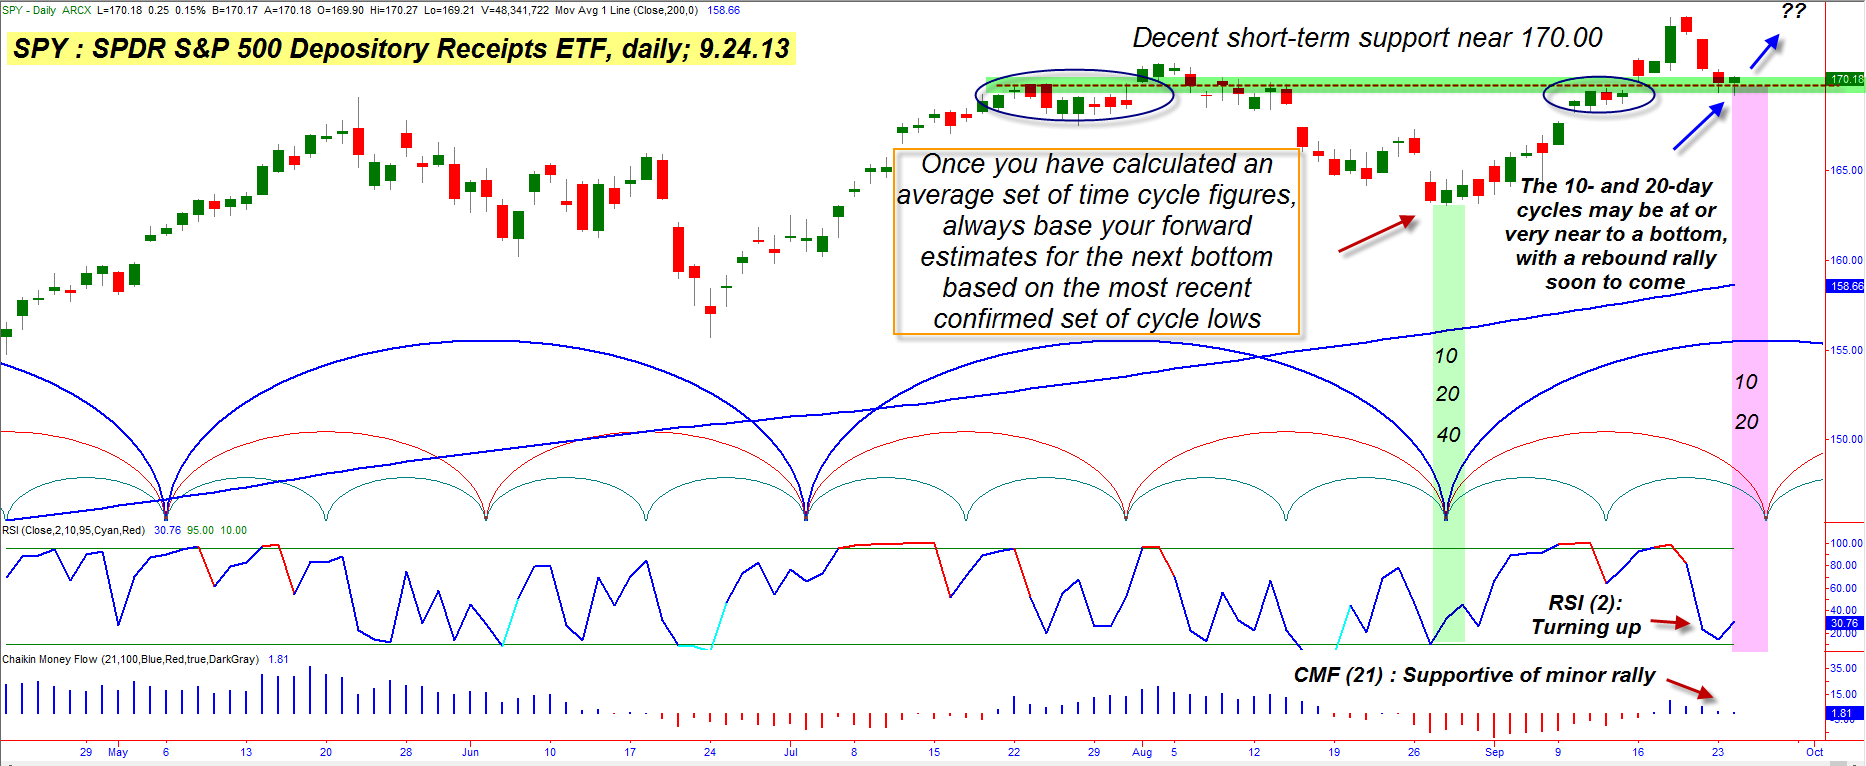
| Figure 1. The 10- and 20-day cycles in the .SPX may be bottoming slightly ahead of schedule, possibly helping confirm the underlying strength still remaining in this key large cap stock index. |
| Graphic provided by: TradeStation. |
| |
| For a very long time, a set of 10-, 20- and 40-day trading cycles has been a recurrent pattern on the daily chart (Figure 1) of the .SPX (SPY and @ES, too). The cycles sometimes stretch and contract, but on average these are reliable numbers, and when two or more of them are in agreement, the probabilities are higher that a tradable reversal is to be expected. It's important for all cycle traders to use the most recent confirmed multicycle low as the starting point for anticipating the next significant cycle lows; for example, the most recent 10/20/40-day lows were made on August 28, 2013 (green vertical marker) and so we can then anticipate that the 10/20-day cycles will bottom sometime around September 26, 2013 (the 40-day isn't due to bottom until late October 2013, FYI) and so we can then begin to look for other clues that a reversal low may be approaching, if not already here: 1. First, check the two-day RSI indicator to see if it has pulled back toward 10.00 (lower readings are even better when looking for a long entry point) as the anticipated multicycle low date approaches. If it has pulled back significantly, you have another clue that the low may be at hand. 2. Next, visually scan your daily chart to see if the pullback in the stock or index is getting close to a meaningful support zone — things like prior swing highs or previous breakout bases. In this case, SPY is indeed near a strong area of support based on two prior breakout bases (circled on chart). In fact, this support area near 170.00 may in fact be the launching pad for the .SPX to move on to another record high, should this pullback result in a new rally, because the support line was actually resistance back between mid-August and mid-September of this year. 3. The entry trigger for a long SPY trade here is simple; just look for a reversal bar to be made after the RSI(2) has bottomed. Then simply go long on a break back above the high of the reversal bar (sometimes this bar will also be the bar that drives the RSI to its ultimate low, but usually isn't, FYI). In this case, a break back above Monday's high of 170.65 should be the signal that brings the bulls back out in force, with yet another drive toward the previous record high of 173.60. 4. A two-bar trailing stop of the daily lows would be a good way to manage the trade and taking partial profits on a rise past 173.50 would also be a good idea, too, trailing the balance until final stop out. |

|
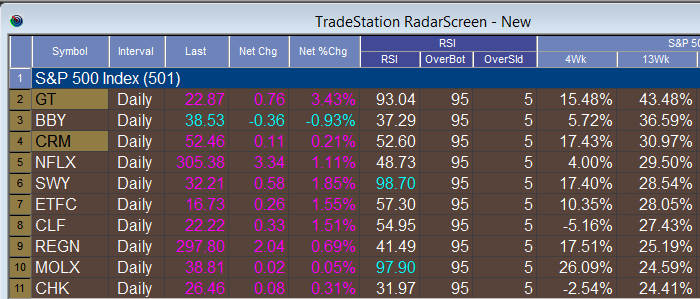
| Figure 2. The ten strongest stocks in the S&P 500 index, based on their comparative 13-week relative strength rankings. |
| Graphic provided by: TradeStation. |
| Graphic provided by: TradeStation Radar Screen. |
| |
| Traders who want to focus on individual .SPX component stocks should seek out those which are also manifesting the same kind of "pullback to support" price dynamics and which also have superior earnings growth and high four- or 13-week relative strength vs. the .SPX. The chart in Figure 2 highlights the 10 strongest stocks in the .SPX right now. Trade with a maximum account risk of 1% (because of the bull market being so long running now) on any stock you decide to go long with and manage the trade according to a fixed set of unbreakable rules. Trade wisely until we meet here again. |
Freelance financial markets writer and online publisher of the Trendzetterz.com S&P 500 Weekly Forecast service.
| Title: | Market consultant and writer |
| Company: | Trendzetterz |
| Address: | 81 Hickory Hollow Drive |
| Crossville, TN 38555 | |
| Phone # for sales: | 904-303-4814 |
| Website: | trendzetterz.com |
| E-mail address: | support@trendzetterz.com |
Traders' Resource Links | |
| Trendzetterz has not added any product or service information to TRADERS' RESOURCE. | |
Click here for more information about our publications!
Comments

Request Information From Our Sponsors
- VectorVest, Inc.
- Executive Premier Workshop
- One-Day Options Course
- OptionsPro
- Retirement Income Workshop
- Sure-Fire Trading Systems (VectorVest, Inc.)
- Trading as a Business Workshop
- VectorVest 7 EOD
- VectorVest 7 RealTime/IntraDay
- VectorVest AutoTester
- VectorVest Educational Services
- VectorVest OnLine
- VectorVest Options Analyzer
- VectorVest ProGraphics v6.0
- VectorVest ProTrader 7
- VectorVest RealTime Derby Tool
- VectorVest Simulator
- VectorVest Variator
- VectorVest Watchdog
- StockCharts.com, Inc.
- Candle Patterns
- Candlestick Charting Explained
- Intermarket Technical Analysis
- John Murphy on Chart Analysis
- John Murphy's Chart Pattern Recognition
- John Murphy's Market Message
- MurphyExplainsMarketAnalysis-Intermarket Analysis
- MurphyExplainsMarketAnalysis-Visual Analysis
- StockCharts.com
- Technical Analysis of the Financial Markets
- The Visual Investor
