

HOT TOPICS LIST
- MACD
- Fibonacci
- RSI
- Gann
- ADXR
- Stochastics
- Volume
- Triangles
- Futures
- Cycles
- Volatility
- ZIGZAG
- MESA
- Retracement
- Aroon
INDICATORS LIST
LIST OF TOPICS
PRINT THIS ARTICLE
by Billy Williams
The market sold off on a huge spike in volume but one stock shrugged it off and is trading higher.
Position: Buy
Billy Williams
Billy Williams has been trading the markets for 27 years, specializing in momentum trading with stocks and options.
PRINT THIS ARTICLE
TECHNICAL ANALYSIS
Visa And Stock Leadership
10/03/13 11:31:00 AMby Billy Williams
The market sold off on a huge spike in volume but one stock shrugged it off and is trading higher.
Position: Buy
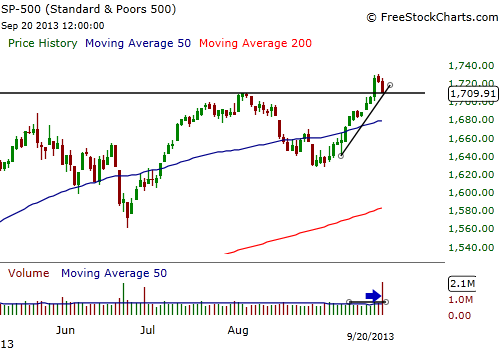
| Since August 28, 2013, the SPX has rallied and been firmly under control of bulls, trading higher while barely pausing. With the exception of a few minor down days, which didn't faze the bullish trend, the SPX has been due for a pullback and/or correction. After a month of trading higher, the recent massive spike in bearish trading volume looks like it might be the clarion call for bears to make a move and force price downward. The SPX traded lower on higher volume but didn't trade below the minor support level of 1700 despite its 50-day daily average swelling to more than three times its normal level. The recent distribution where daily volume swelled more than three times the 50-day average daily volume level, caused several stocks to pull back but their stock leadership didn't follow that path. In fact, many stock leaders, like Visa, shrugged off the bears attempts to take its price down lower by going higher. |
|
| Figure 1. The SPX has been on a major bull run since August 28, 2013 but pulled back on a huge spike in selling volume and finding minor support at the 1700 level. |
| Graphic provided by: www.freestockcharts.com. |
| |
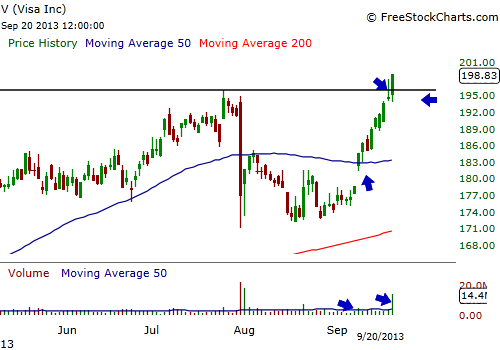
| Visa (V) had been rebuilding its bullish run till a Washington, D.C. district court judge ruled that the Federal Reserve's limit on debit card "swipe" fees implemented in the wake of the 2010 Dodd-Frank law is too high. As a result, shares fell over 7.50%, mostly an overreaction by traders and price quickly rebounded the next day. Though price was sluggish in the following trading days since the announcement, cooler heads realized that this was an opportunity to snatch up shares at a discount. Support formed around the $172 price level and price action contracted in a tight range for several weeks. Later, on September 10, 2013, V gapped higher after firing off a pocket pivot entry signal, and closed over its 50-day SMA. |
|
| Figure 2. Visa has recovered from a previous decline brought on by investor's overreaction and signaled a pocket pivot entry on two separate occasions. The stock seems to be unaffected by the market sell off and looks like it will continue to go higher. |
| Graphic provided by: www.freestockcharts.com. |
| |
| Firmly in bullish territory over the 50-day SMA, V went on to trade higher on consecutive days, nearing its all-time high, a strong bullish indicator for a stock's price action. Trading at all-time highs gives you an edge in that there is no overhead resistance lying ahead since there are no price highs and lows where previous investors may be holding old positions. These investors will often hang on for price to come back after a serious decline and then sell to break even. This cluster of selling can cause a stock's price action to become erratic and slow its ascent. With all-time highs, trends stay in motion until an equal or larger force derails its advance so it has the advantage of momentum on its side, giving you another key advantage. |
| However, September 19, 2013, the day that V traded up through its former high of $196 was not the day to take a position due to poor volume. Price breakouts at former price highs should be accompanied by at least a 40% rise over the 50-day average daily volume before entering. Less than that, and you run the risk of getting stopped out by a false breakout because the stock didn't have enough "fuel" to follow-through on its move. |
| Instead, the following day, on September 20, 2013, was the day to enter V as volume swelled to over 350% of its 50-day average daily volume, with the price bar closing at the upper limit of its intraday trading range. The SPX is in bullish control so an entry into a stock like V given its price action in the current market environment would make sense. If you've missed the move, wait for a low-volume pullback and enter with a stop that's 7% from your entry price. Look to add more to the position if the opportunity presents itself as the market is due for a seasonal bull run to close out 2013. |
Billy Williams has been trading the markets for 27 years, specializing in momentum trading with stocks and options.
| Company: | StockOptionSystem.com |
| E-mail address: | stockoptionsystem.com@gmail.com |
Traders' Resource Links | |
| StockOptionSystem.com has not added any product or service information to TRADERS' RESOURCE. | |
Click here for more information about our publications!
Comments

Request Information From Our Sponsors
- StockCharts.com, Inc.
- Candle Patterns
- Candlestick Charting Explained
- Intermarket Technical Analysis
- John Murphy on Chart Analysis
- John Murphy's Chart Pattern Recognition
- John Murphy's Market Message
- MurphyExplainsMarketAnalysis-Intermarket Analysis
- MurphyExplainsMarketAnalysis-Visual Analysis
- StockCharts.com
- Technical Analysis of the Financial Markets
- The Visual Investor
- VectorVest, Inc.
- Executive Premier Workshop
- One-Day Options Course
- OptionsPro
- Retirement Income Workshop
- Sure-Fire Trading Systems (VectorVest, Inc.)
- Trading as a Business Workshop
- VectorVest 7 EOD
- VectorVest 7 RealTime/IntraDay
- VectorVest AutoTester
- VectorVest Educational Services
- VectorVest OnLine
- VectorVest Options Analyzer
- VectorVest ProGraphics v6.0
- VectorVest ProTrader 7
- VectorVest RealTime Derby Tool
- VectorVest Simulator
- VectorVest Variator
- VectorVest Watchdog