HOT TOPICS LIST
- MACD
- Fibonacci
- RSI
- Gann
- ADXR
- Stochastics
- Volume
- Triangles
- Futures
- Cycles
- Volatility
- ZIGZAG
- MESA
- Retracement
- Aroon
INDICATORS LIST
LIST OF TOPICS
PRINT THIS ARTICLE
by Donald W. Pendergast, Jr.
Shares of Micron Technology have been going like gangbusters since the fourth quarter of 2012, but it's due for another correction soon.
Position: N/A
Donald W. Pendergast, Jr.
Freelance financial markets writer and online publisher of the Trendzetterz.com S&P 500 Weekly Forecast service.
PRINT THIS ARTICLE
CYCLES
Micron Technology: Close To The Summit?
09/23/13 05:10:15 PMby Donald W. Pendergast, Jr.
Shares of Micron Technology have been going like gangbusters since the fourth quarter of 2012, but it's due for another correction soon.
Position: N/A
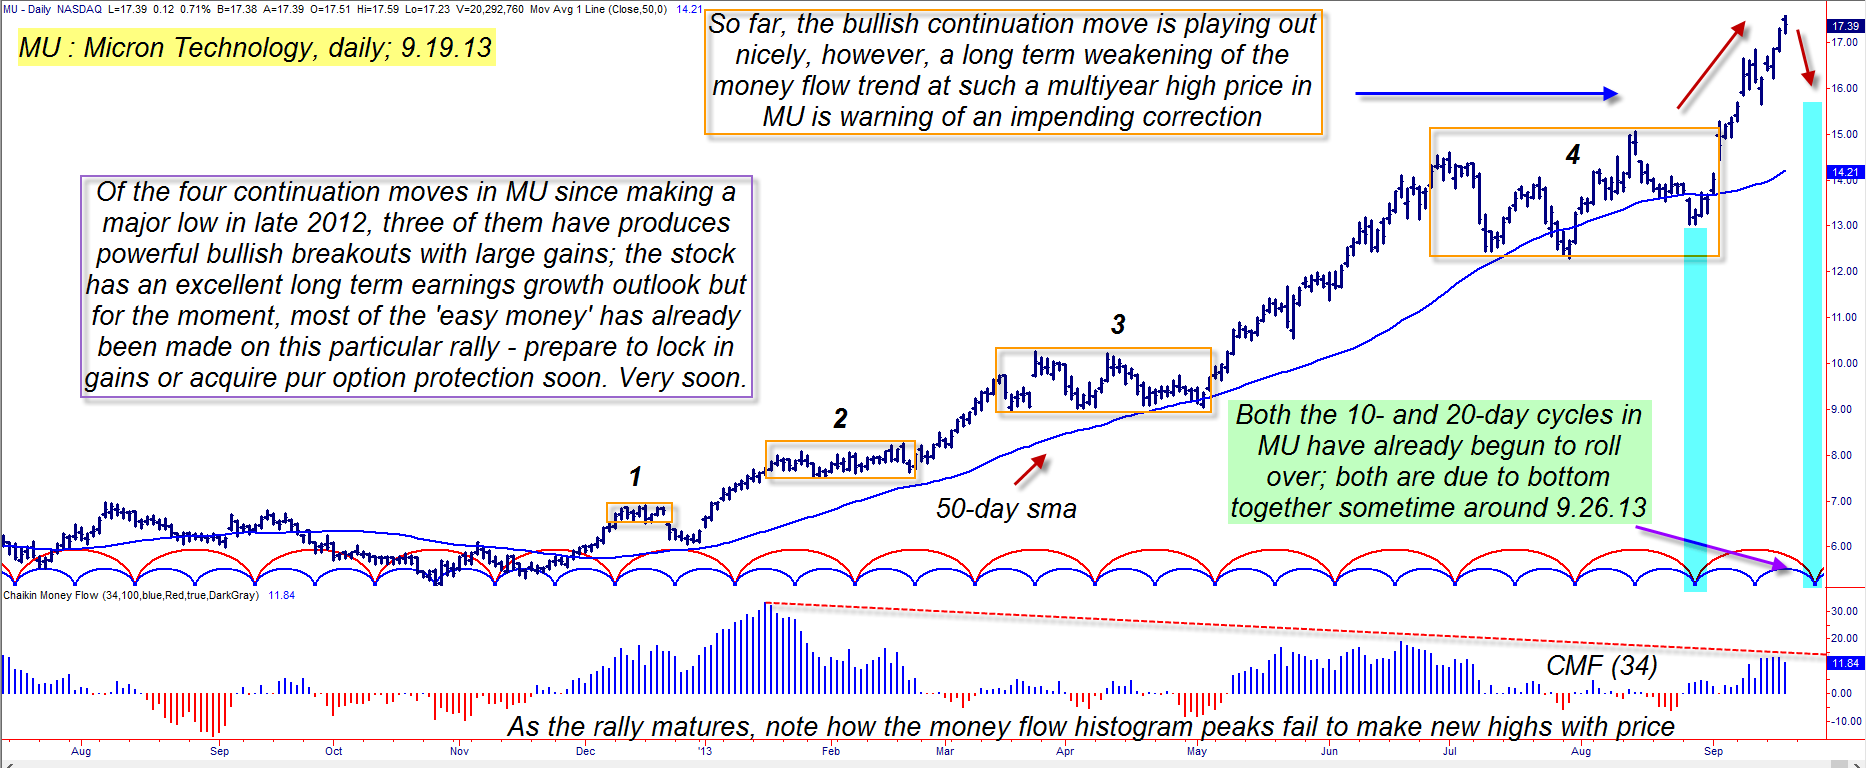
| Up by more than 240% between November 2012 and September 2013, shares of Micron Technology have been a true bull market leader; the stock has made three successful bullish continuation moves (out of four continuation setups) and has been helping to power both the S&P 500 (.SPX) and NASDAQ 100 (.NDX) indexes to all-time and/or multiyear highs since making its last major multicycle low in November 2012. But all trends correct sooner or later, and MU's technicals and cycle studies are now suggesting that a near-term correction is a virtual certainty as September gives way to October. Here's a closer look (Figure 1). |

|
| Figure 1. Micron Technology (MU) has been a big winner for the last 10 months; near-term probabilities suggest that another pullback will occur fairly soon, however. |
| Graphic provided by: TradeStation. |
| |
| One of the most remarkable aspects of the daily chart in Figure 1 are the four bullish continuation patterns — three of which were successful — that printed since the fourth quarter of 2012. The first one (December 2012) failed, but prices regained strength soon after, with even larger and more powerful bullish breakouts from the three additional continuation patterns in February, May, and September 2013, respectively. The most recent bullish break from consolidation has already produced open gains of nearly 17% since September 4, 2013. For the bulls, it's doubtful that they could be any happier about this, but they also need to be aware of the following: 1. As with the S&P 400/500 indexes, MU's long-term money flow trend is showing a clear pattern of distribution by the "smart money" — this is where the strong hands in the market (big mutual funds, investment banks, hedge funds, Soros, etc) are actively scaling out of their positions, with lesser-informed latecomers only too willing to buy the stock from the big money interests who ultimately control the market. To see MU's 34-day Chaikin Money flow histogram at such a pitifully low reading even as the stock trades near multiyear highs is as clear an "early warning" signal as any. 2. MU's 10- and 20-day price cycles have already begun to roll over, with both cycles expected to bottom together sometime around September 26, 2013. All of the major US stock indexes are also due to make a variety of 8-, 10-, 16-and 20-day lows by late September 2013. 3. The recent rally since early September could be ripe for profit taking as the dynamics in one and two play out in the days ahead. |

|
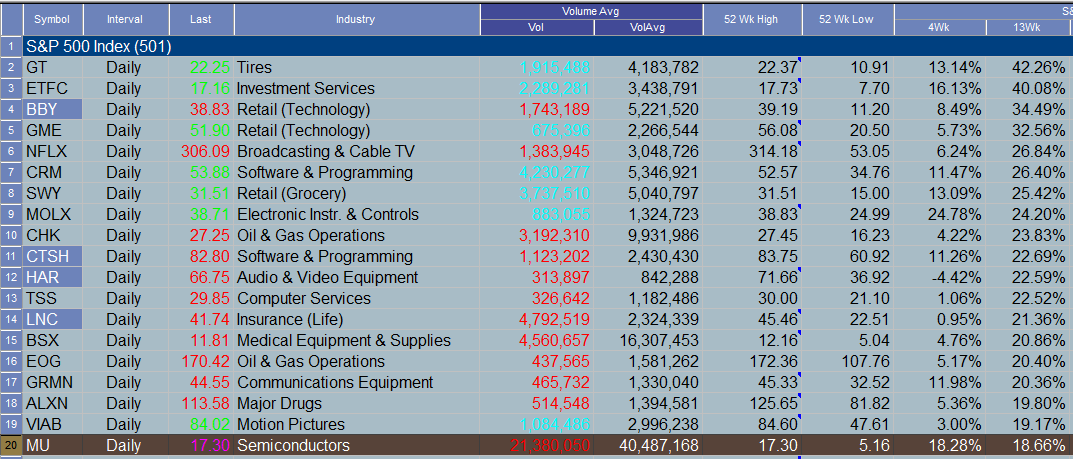
| Figure 2. MU continues to outperform the .SPX over the past 4- and 13- week periods. |
| Graphic provided by: TradeStation. |
| Graphic provided by: TradeStation Radar Screen. |
| |
| Trying to "call" the top in a high-momentum bull market winner like MU is a fool's game, so don't even think about shorting MU here. However, if you are looking to buy MU on a low risk pullback, the best plan is to patiently wait until it makes its next combined 10- and 20-day cycle low, followed by a bullish key reversal bar to alert you of the next buy setup. You can use a two- or three-period RSI indicator that has dropped below 5.00 to alert you to such a setup in the making, especially if it takes place above both the stock's 50- and/or 200-day moving averages. The blue average on the chart is the 50-day simple moving average. Also, if you're currently long MU, make sure you are running a trailing stop and/or have a protective put option strategy already in place. MU looks to be a great long-term market winner, but if you are more of a swing trader you want to be preparing for some major changes in MU's near-term direction. Trade wisely until we meet again. |
Freelance financial markets writer and online publisher of the Trendzetterz.com S&P 500 Weekly Forecast service.
| Title: | Market consultant and writer |
| Company: | Trendzetterz |
| Address: | 81 Hickory Hollow Drive |
| Crossville, TN 38555 | |
| Phone # for sales: | 904-303-4814 |
| Website: | trendzetterz.com |
| E-mail address: | support@trendzetterz.com |
Traders' Resource Links | |
| Trendzetterz has not added any product or service information to TRADERS' RESOURCE. | |
Click here for more information about our publications!
PRINT THIS ARTICLE

Request Information From Our Sponsors
- StockCharts.com, Inc.
- Candle Patterns
- Candlestick Charting Explained
- Intermarket Technical Analysis
- John Murphy on Chart Analysis
- John Murphy's Chart Pattern Recognition
- John Murphy's Market Message
- MurphyExplainsMarketAnalysis-Intermarket Analysis
- MurphyExplainsMarketAnalysis-Visual Analysis
- StockCharts.com
- Technical Analysis of the Financial Markets
- The Visual Investor
- VectorVest, Inc.
- Executive Premier Workshop
- One-Day Options Course
- OptionsPro
- Retirement Income Workshop
- Sure-Fire Trading Systems (VectorVest, Inc.)
- Trading as a Business Workshop
- VectorVest 7 EOD
- VectorVest 7 RealTime/IntraDay
- VectorVest AutoTester
- VectorVest Educational Services
- VectorVest OnLine
- VectorVest Options Analyzer
- VectorVest ProGraphics v6.0
- VectorVest ProTrader 7
- VectorVest RealTime Derby Tool
- VectorVest Simulator
- VectorVest Variator
- VectorVest Watchdog
