

HOT TOPICS LIST
- MACD
- Fibonacci
- RSI
- Gann
- ADXR
- Stochastics
- Volume
- Triangles
- Futures
- Cycles
- Volatility
- ZIGZAG
- MESA
- Retracement
- Aroon
INDICATORS LIST
LIST OF TOPICS
PRINT THIS ARTICLE
by Donald W. Pendergast, Jr.
The Fed-induced mini-rally on Wednesday made the bulls very happy, but is the latest multimonth rally in the Dow just about done?
Position: N/A
Donald W. Pendergast, Jr.
Freelance financial markets writer and online publisher of the Trendzetterz.com S&P 500 Weekly Forecast service.
PRINT THIS ARTICLE
DIA: Money Flow Flat As Price Surges
09/23/13 10:25:27 AMby Donald W. Pendergast, Jr.
The Fed-induced mini-rally on Wednesday made the bulls very happy, but is the latest multimonth rally in the Dow just about done?
Position: N/A
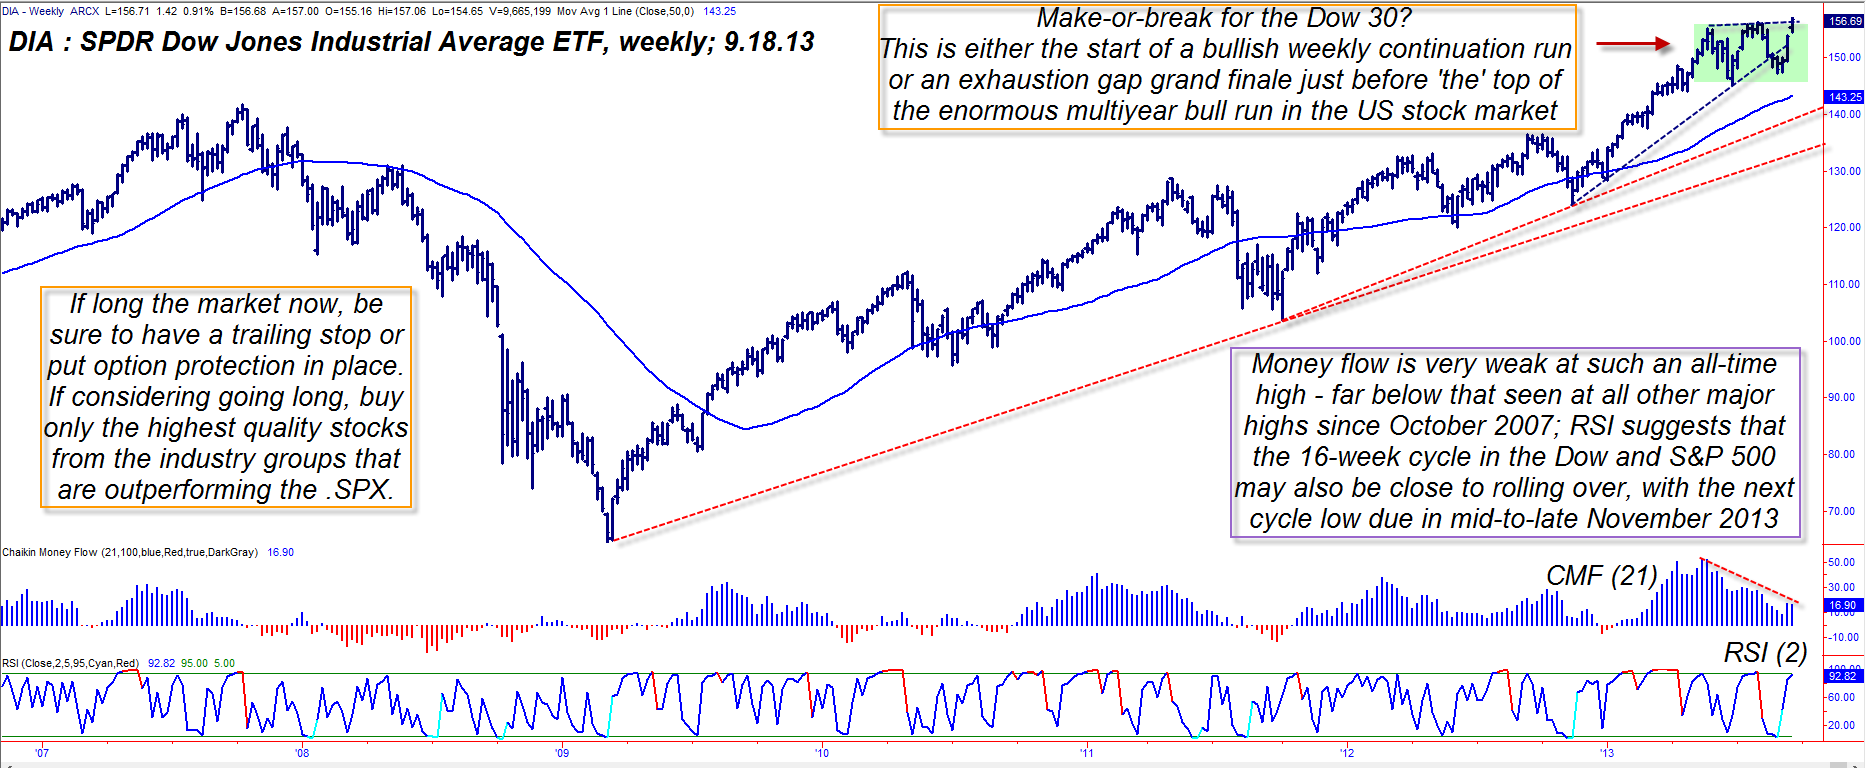
| The old-time stalwart of US stock indexes, the Dow Jones Industrial average (.DJIA, DIA) is once again trading up near its all-time highs as the Fed announces that they are going to continue their bond purchasing agenda for the time being. Investors and traders were quick to react, prompting a sharp rally during the last two hours of Wednesday's trading session. The next few weeks will likely resolve any questions regarding the next sustained swing move in the Dow. Here's a closer look now (Figure 1). |
|
| Figure 1. The weekly chart of DIA reveals a very weak money flow structure for an index still trading near its all-time highs. A failed bullish breakout may imply that a bearish trend reversal is imminent. |
| Graphic provided by: TradeStation. |
| |
| The Dow 30 (represented here by the Diamonds ETF (DIA)) is up by nearly 143% since the first week of March 2009; the index is made up of the 30 stocks in the .DJIA and has shown remarkable resiliency. Even after the panic selloffs in 2010 and 2011 it has continued to bounce back strongly — so much so that it has continued to make new record highs between May and September 2013. But this market is now at a classic "make or break" juncture, one that should soon allow traders/investors to determine the "line of least resistance" upon which it may be most likely to embark over the next few weeks and/or months. Here are the essentials to be aware of: 1. The 21-week Chaikin Money flow histogram (CMF)(21) is at a horrifically low reading for a major stock index trading within a fraction of its all-time highs; in fact, the current reading of the histogram is lower than it was at every significant major high seen in the Dow since early 2007. Even the 34- and 89-week versions of this money flow indicator are confirming that distribution is underway. 2. The green shaded zone is indeed a potential continuation pattern setup for the bulls, but you still need to see a weekly close above the pattern to confirm the breakout. If that happens then it's likely that there will be yet another push higher up toward the 160.00 area (about 16,000 on the Dow 30 index; however, notice the latest gap; it could actually be an exhaustion gap, the kind typically seen just before a major trend reversal. The "smart money" loves to be able to gap a stock or index higher — thus luring in the last of the bulls — just before they sell the stuffing out of it, dragging it lower and forcing the latecomers out of their long positions. This could be a "bull trap" too, one that will be remembered for a long time to come. 3. The 16-week cycle in the DIA isn't due to bottom again until mid-to-late November 2013, and if this is "the" high, then the selling could be noticeable over the next six to nine weeks, especially after such a nice run higher since mid-November 2012. |
|
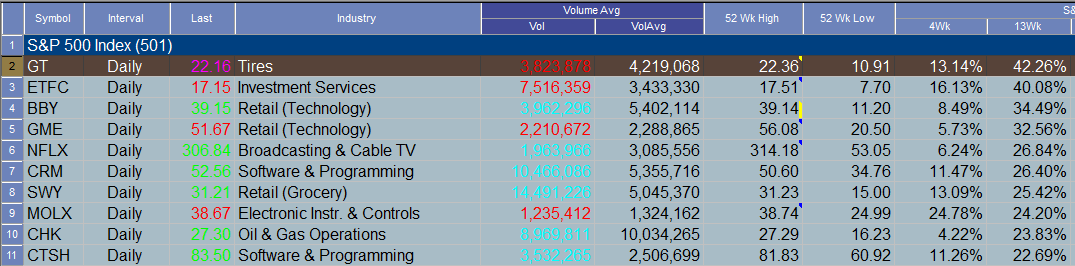
| Figure 2. Here are the ten strongest stocks in the S&P 500 index (.SPX) based on their 13-week comparative relative strength rankings. |
| Graphic provided by: TradeStation. |
| Graphic provided by: TradeStation Radar Screen. |
| |
| So yes, the market can always run higher, and for reasons that aren't necessarily factored into the price charts ("smart money" manipulation, an easy money policy by a central bank, deliberate currency devaluation – which is the real reason for the historic run higher since 2009), but the odds are extremely slim that another multimonth rally is about to erupt now. The odds are highly stacked in favor of a failed break to a higher high, followed soon thereafter by a multiweek correction back to the red trend line near the 142.00 level. If you must try to go long now, make sure you see a clean break above the green shaded zone and then only buy the stocks with the best string of positive earnings surprises. If you're already long the market, make sure you have a trailing stop or put option protection plan in place. And if you're in cash and a bit nervous, good for you; simply wait for the next 16-week cycle low sometime in late November 2013 and make sure you have your stock "wish list" already written out in anticipation of a good low-risk buying opportunity then. Trade wisely until we meet again. |
Freelance financial markets writer and online publisher of the Trendzetterz.com S&P 500 Weekly Forecast service.
| Title: | Market consultant and writer |
| Company: | Trendzetterz |
| Address: | 81 Hickory Hollow Drive |
| Crossville, TN 38555 | |
| Phone # for sales: | 904-303-4814 |
| Website: | trendzetterz.com |
| E-mail address: | support@trendzetterz.com |
Traders' Resource Links | |
| Trendzetterz has not added any product or service information to TRADERS' RESOURCE. | |
Click here for more information about our publications!
Comments

Request Information From Our Sponsors
- StockCharts.com, Inc.
- Candle Patterns
- Candlestick Charting Explained
- Intermarket Technical Analysis
- John Murphy on Chart Analysis
- John Murphy's Chart Pattern Recognition
- John Murphy's Market Message
- MurphyExplainsMarketAnalysis-Intermarket Analysis
- MurphyExplainsMarketAnalysis-Visual Analysis
- StockCharts.com
- Technical Analysis of the Financial Markets
- The Visual Investor
- VectorVest, Inc.
- Executive Premier Workshop
- One-Day Options Course
- OptionsPro
- Retirement Income Workshop
- Sure-Fire Trading Systems (VectorVest, Inc.)
- Trading as a Business Workshop
- VectorVest 7 EOD
- VectorVest 7 RealTime/IntraDay
- VectorVest AutoTester
- VectorVest Educational Services
- VectorVest OnLine
- VectorVest Options Analyzer
- VectorVest ProGraphics v6.0
- VectorVest ProTrader 7
- VectorVest RealTime Derby Tool
- VectorVest Simulator
- VectorVest Variator
- VectorVest Watchdog