

HOT TOPICS LIST
- MACD
- Fibonacci
- RSI
- Gann
- ADXR
- Stochastics
- Volume
- Triangles
- Futures
- Cycles
- Volatility
- ZIGZAG
- MESA
- Retracement
- Aroon
INDICATORS LIST
LIST OF TOPICS
PRINT THIS ARTICLE
by Koos van der Merwe
Looking for stocks to buy as the market bottoms is always a challenge.
Position: Buy
Koos van der Merwe
Has been a technical analyst since 1969, and has worked as a futures and options trader with First Financial Futures in Johannesburg, South Africa.
PRINT THIS ARTICLE
ELLIOTT WAVE
1-800 Flowers.com, Inc.
09/19/13 04:21:57 PMby Koos van der Merwe
Looking for stocks to buy as the market bottoms is always a challenge.
Position: Buy
| 1-800-Flowers.com, Inc. is a florist and gift shop that has delivered gifts to their customers. They've been selling items such as fresh flowers, plants, gift baskets, gourmet foods, confections, etc. for more than 35 years. The company was also rated number one vs. competitors for customer service by StellaService in 2011 and named by the E-Tailing Group as one of only nine online retailers out of 100 benchmarked to meet the criteria for excellence in online customer service in 2011. What do the charts say as to the company's future? |
|
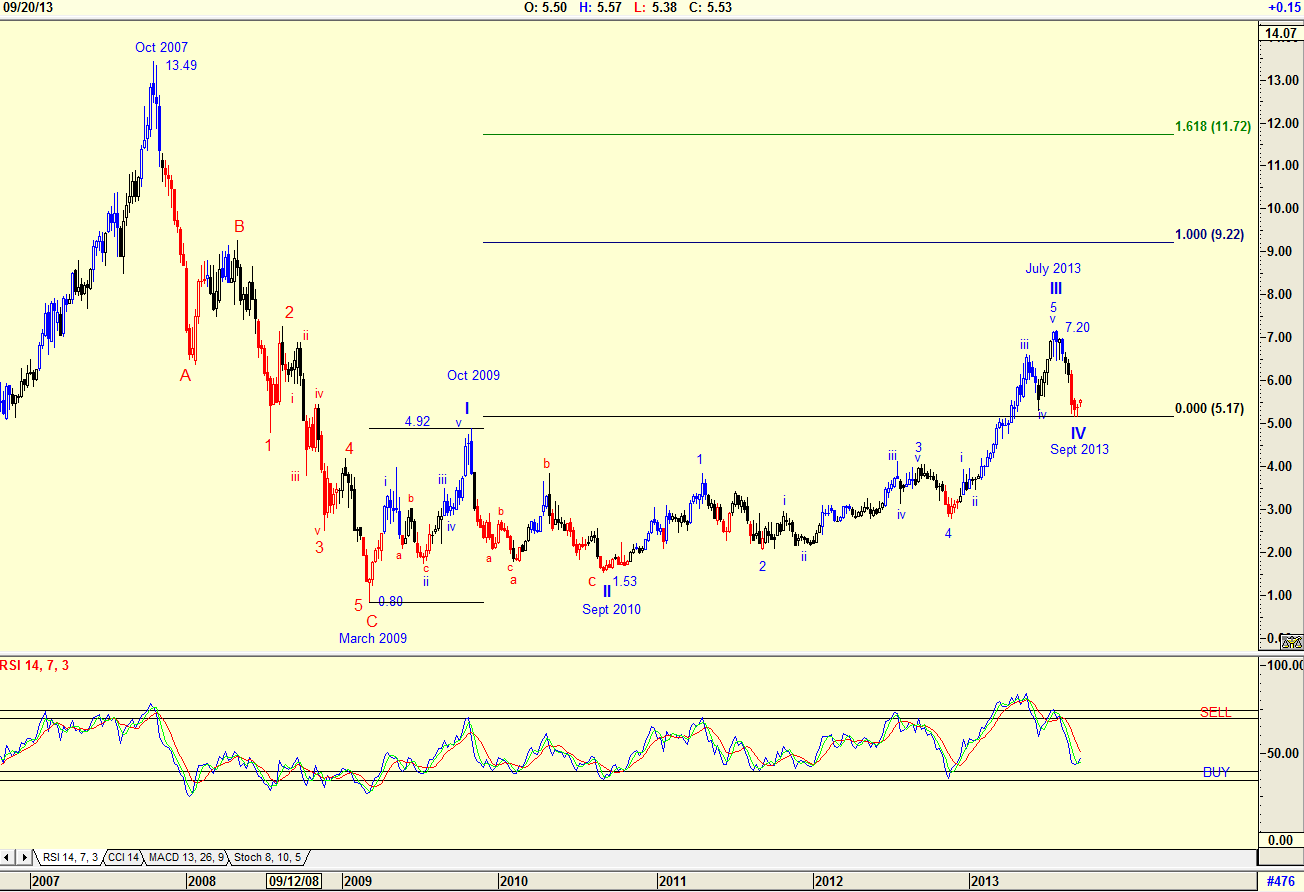
| Figure 1. Weekly chart suggesting targets. |
| Graphic provided by: AdvancedGET. |
| |
| The weekly chart in Figure 1 shows how the price fell with the market meltdown from a high of $13.49 in October 2007 to a low of $0.80 by March 2009. The Elliott wave count for the fall is a perfect count. The rise in WAVE I to $4.92 by October 2009 is a complicated count with minor wave iii only slightly higher than minor wave i. However, the count does look correct because the Elliott rule is that if wave 2 is a complicated wave, then wave 4 must be a simple wave, and vice versa. In this case minor wave ii is complicated, so minor wave iv must be simple, which it is. Major WAVE II is also a complicated wave, falling from $4.92 in October 2009 to $1.53 by September 2010. This means that Major WAVE IV should be a simple count, and looking at the chart it looks as if it is. A wave 5 must be equal to or greater than a wave 1. Projecting a target for Major WAVE V from the low of Major WAVE IV suggests a target of $9.22 or $11.72, a 1.618 Fibonacci projection. The RSI indicator is, however, suggesting that Major WAVE IV could still fall further, because it has not yet reached the buy zone. |
|
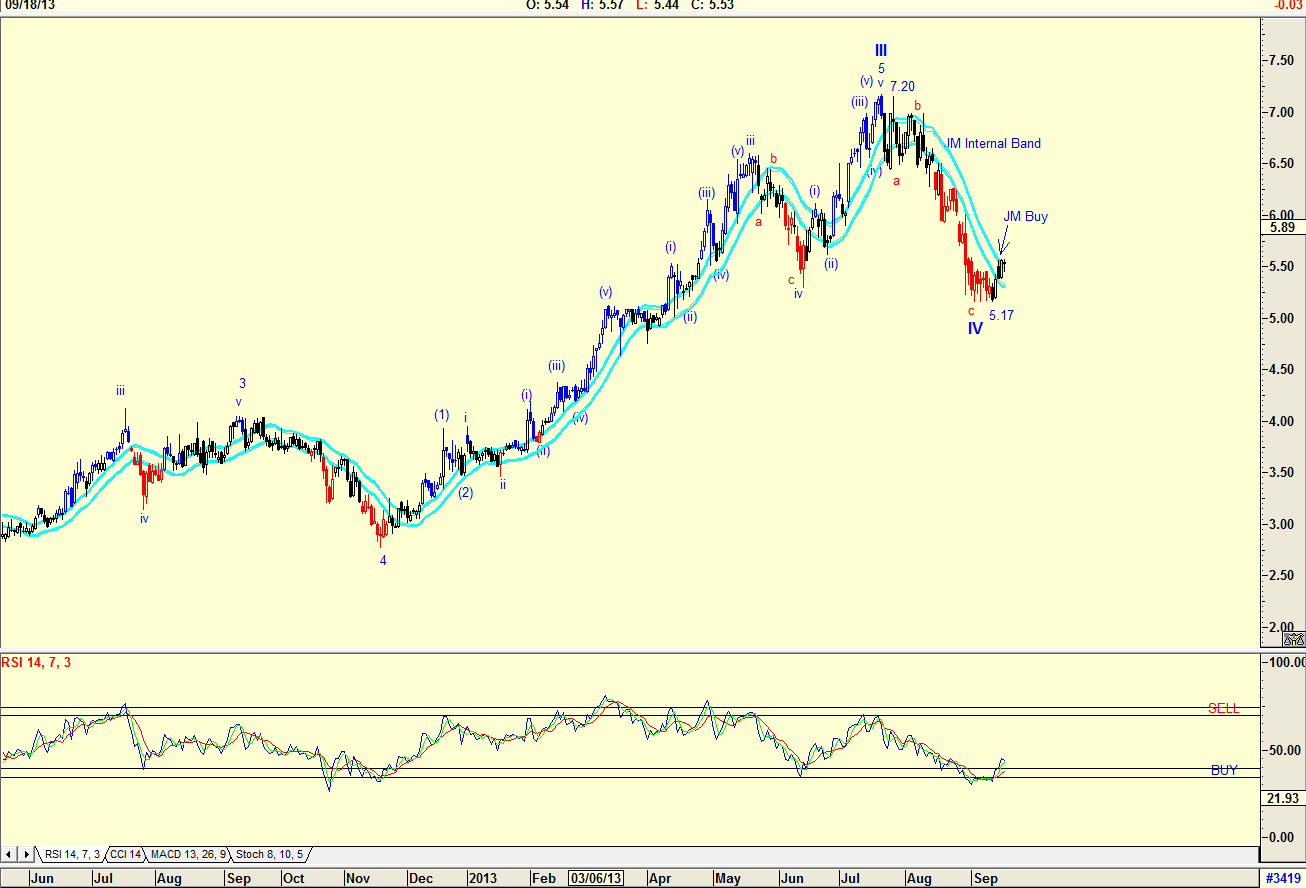
| Figure 2. Daily charts showing BUY signals. |
| Graphic provided by: AdvancedGET. |
| |
| The daily chart in Figure 2 suggests that the price has bottomed in a Wave IV. This is confirmed by the RSI indicator which has reached oversold levels and has given a buy signal. The target suggested by the weekly chart in Figure 1 could therefore be reached. However, should the price rise to test the WAVE III high of $7.20, a profitable return would be reached. With the price breaking above the upper band of the JM internal band indicator, buying the share is a must. The JM internal band indicator is a 15-period simple moving average offset by 2% positive and 2% negative. A move above the upper band suggests a buy, and a move below the lower band is a sell signal. I would be a buyer of 1-800-Flowers at the current price. |
Has been a technical analyst since 1969, and has worked as a futures and options trader with First Financial Futures in Johannesburg, South Africa.
| Address: | 3256 West 24th Ave |
| Vancouver, BC | |
| Phone # for sales: | 6042634214 |
| E-mail address: | petroosp@gmail.com |
Click here for more information about our publications!
PRINT THIS ARTICLE

Request Information From Our Sponsors
- StockCharts.com, Inc.
- Candle Patterns
- Candlestick Charting Explained
- Intermarket Technical Analysis
- John Murphy on Chart Analysis
- John Murphy's Chart Pattern Recognition
- John Murphy's Market Message
- MurphyExplainsMarketAnalysis-Intermarket Analysis
- MurphyExplainsMarketAnalysis-Visual Analysis
- StockCharts.com
- Technical Analysis of the Financial Markets
- The Visual Investor
- VectorVest, Inc.
- Executive Premier Workshop
- One-Day Options Course
- OptionsPro
- Retirement Income Workshop
- Sure-Fire Trading Systems (VectorVest, Inc.)
- Trading as a Business Workshop
- VectorVest 7 EOD
- VectorVest 7 RealTime/IntraDay
- VectorVest AutoTester
- VectorVest Educational Services
- VectorVest OnLine
- VectorVest Options Analyzer
- VectorVest ProGraphics v6.0
- VectorVest ProTrader 7
- VectorVest RealTime Derby Tool
- VectorVest Simulator
- VectorVest Variator
- VectorVest Watchdog