

HOT TOPICS LIST
- MACD
- Fibonacci
- RSI
- Gann
- ADXR
- Stochastics
- Volume
- Triangles
- Futures
- Cycles
- Volatility
- ZIGZAG
- MESA
- Retracement
- Aroon
INDICATORS LIST
LIST OF TOPICS
PRINT THIS ARTICLE
by Matt Blackman
Stocks continued to ignore the usual September perils to mid-month. But here is another indication that not all is going swimmingly in global markets.
Position: N/A
Matt Blackman
Matt Blackman is a full-time technical and financial writer and trader. He produces corporate and financial newsletters, and assists clients in getting published in the mainstream media. He is the host of TradeSystemGuru.com. Matt has earned the Chartered Market Technician (CMT) designation. Find out what stocks and futures Matt is watching on Twitter at www.twitter.com/RatioTrade
PRINT THIS ARTICLE
CORRELATION ANALYSIS
What's Up With The Intermarket Disconnect?
09/18/13 03:58:08 PMby Matt Blackman
Stocks continued to ignore the usual September perils to mid-month. But here is another indication that not all is going swimmingly in global markets.
Position: N/A
| I saw a video recently showing Jim Cramer discussing how powerful this rally has been with "all" stock groups moving up together, which he said was somewhat unusual. Granted many sectors from Music & Videos (up 361% in the last 12 months) to Savings & Loans (up 23%) have been strong. But the same can't be said across all asset classes and markets. |
|
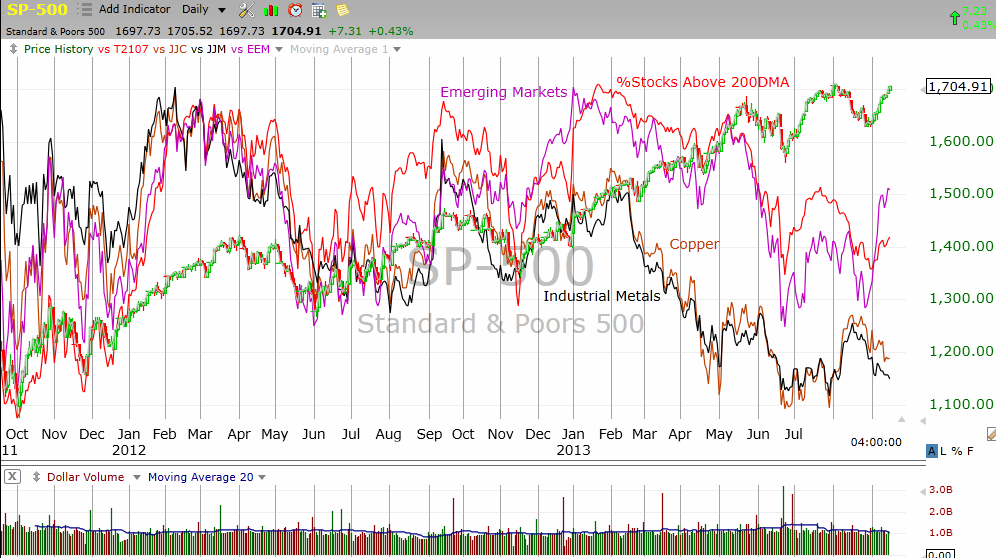
| Figure 1 � Daily chart comparing the S&P500 Index, iPath DJ-UBS Copper Total Return ETF, iPath DJ-UBS Industrial Metals ETF, iShares MSCI Emerging Markets ETF and the Percent of Stocks Trading Above their 200 Day Moving Averages. |
| Graphic provided by: TC2000.com. |
| |
| When we step back and look at the market from 30,000 feet, the picture is not so robust. In Figure 1 you see a daily chart of the S&P500 index together with the iPath DJ-UBS Copper Total Return ETF (JJC), the iPath DJ-UBS Industrial Metals ETF (JJM), the iShares MSCI Emerging Markets ETF (EEM), and the percent of US stocks trading above their 200-day moving average (MA). Since 2011, nearly every stock market rally had been either led or joined by the other groups. And the groups appear to peak and drop at more or less the same time — that is until early in 2013 as the SPX rallied higher while the other groups rolled over. |
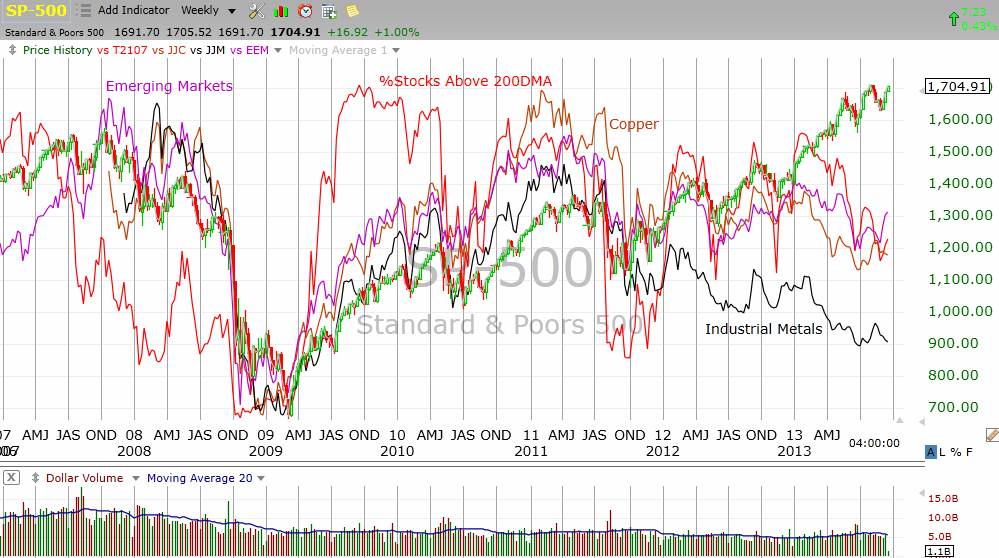
| As Figure 2 shows, the correlation between all groups held true between 2007 and 2013. But notice what happened to the percent of stocks trading above their 200-day MA at the left side of the chart. This market breadth indicator peaked in February 2007, months before stocks and the other groups. In other words, the larger basket of stocks weakened before the headline stocks of the S&P500 (Dow Jones Industrial Average and other large cap indexes.) |
|
| Figure 2 � Weekly chart comparing the S&P500 Index, iPath DJ-UBS Copper Total Return ETF, iPath DJ-UBS Industrial Metals ETF, iShares MSCI Emerging Markets ETF and the Percent of Stocks Trading Above their 200 Day Moving Averages since 2007. |
| Graphic provided by: TC2000.com. |
| |
| So what does it mean? In 2008 and 2009, world markets were changed forever by the introduction of unprecedented fiscal stimulus programs around the globe and the new "too big to fail" government mandated dogma for big banks and insurance companies. This approach was initially positive for all the groups in this chart. But after two years of stimulus, the impact on the larger universe of US stocks, emerging markets, and industrial metals appears to have waned with the effect being more pronounced in emerging markets. |
| What this chart is saying to me is that as long as QE programs continue, the impact should be positive on the major indexes but it is having a declining impact on many industries, manufacturing, and emerging markets as well as the larger basket of US stocks as well. The negative divergence we are seeing between US stocks and other markets is something that is worth monitoring because it could spell trouble for stocks as the Fed tapering kicks in with a vengeance. |
Matt Blackman is a full-time technical and financial writer and trader. He produces corporate and financial newsletters, and assists clients in getting published in the mainstream media. He is the host of TradeSystemGuru.com. Matt has earned the Chartered Market Technician (CMT) designation. Find out what stocks and futures Matt is watching on Twitter at www.twitter.com/RatioTrade
| Company: | TradeSystemGuru.com |
| Address: | Box 2589 |
| Garibaldi Highlands, BC Canada | |
| Phone # for sales: | 604-898-9069 |
| Fax: | 604-898-9069 |
| Website: | www.tradesystemguru.com |
| E-mail address: | indextradermb@gmail.com |
Traders' Resource Links | |
| TradeSystemGuru.com has not added any product or service information to TRADERS' RESOURCE. | |
Click here for more information about our publications!
Comments

Request Information From Our Sponsors
- StockCharts.com, Inc.
- Candle Patterns
- Candlestick Charting Explained
- Intermarket Technical Analysis
- John Murphy on Chart Analysis
- John Murphy's Chart Pattern Recognition
- John Murphy's Market Message
- MurphyExplainsMarketAnalysis-Intermarket Analysis
- MurphyExplainsMarketAnalysis-Visual Analysis
- StockCharts.com
- Technical Analysis of the Financial Markets
- The Visual Investor
- VectorVest, Inc.
- Executive Premier Workshop
- One-Day Options Course
- OptionsPro
- Retirement Income Workshop
- Sure-Fire Trading Systems (VectorVest, Inc.)
- Trading as a Business Workshop
- VectorVest 7 EOD
- VectorVest 7 RealTime/IntraDay
- VectorVest AutoTester
- VectorVest Educational Services
- VectorVest OnLine
- VectorVest Options Analyzer
- VectorVest ProGraphics v6.0
- VectorVest ProTrader 7
- VectorVest RealTime Derby Tool
- VectorVest Simulator
- VectorVest Variator
- VectorVest Watchdog