

HOT TOPICS LIST
- MACD
- Fibonacci
- RSI
- Gann
- ADXR
- Stochastics
- Volume
- Triangles
- Futures
- Cycles
- Volatility
- ZIGZAG
- MESA
- Retracement
- Aroon
INDICATORS LIST
LIST OF TOPICS
PRINT THIS ARTICLE
by Donald W. Pendergast, Jr.
If you want advance notice of an impending short-term cycle high or cycle low, simply keep track of the ratio of overbought to oversold stocks.
Position: N/A
Donald W. Pendergast, Jr.
Freelance financial markets writer and online publisher of the Trendzetterz.com S&P 500 Weekly Forecast service.
PRINT THIS ARTICLE
OVERBOUGHT OVERSOLD
MDY: Overboughts Outweighing Oversolds
09/17/13 03:28:12 PMby Donald W. Pendergast, Jr.
If you want advance notice of an impending short-term cycle high or cycle low, simply keep track of the ratio of overbought to oversold stocks.
Position: N/A
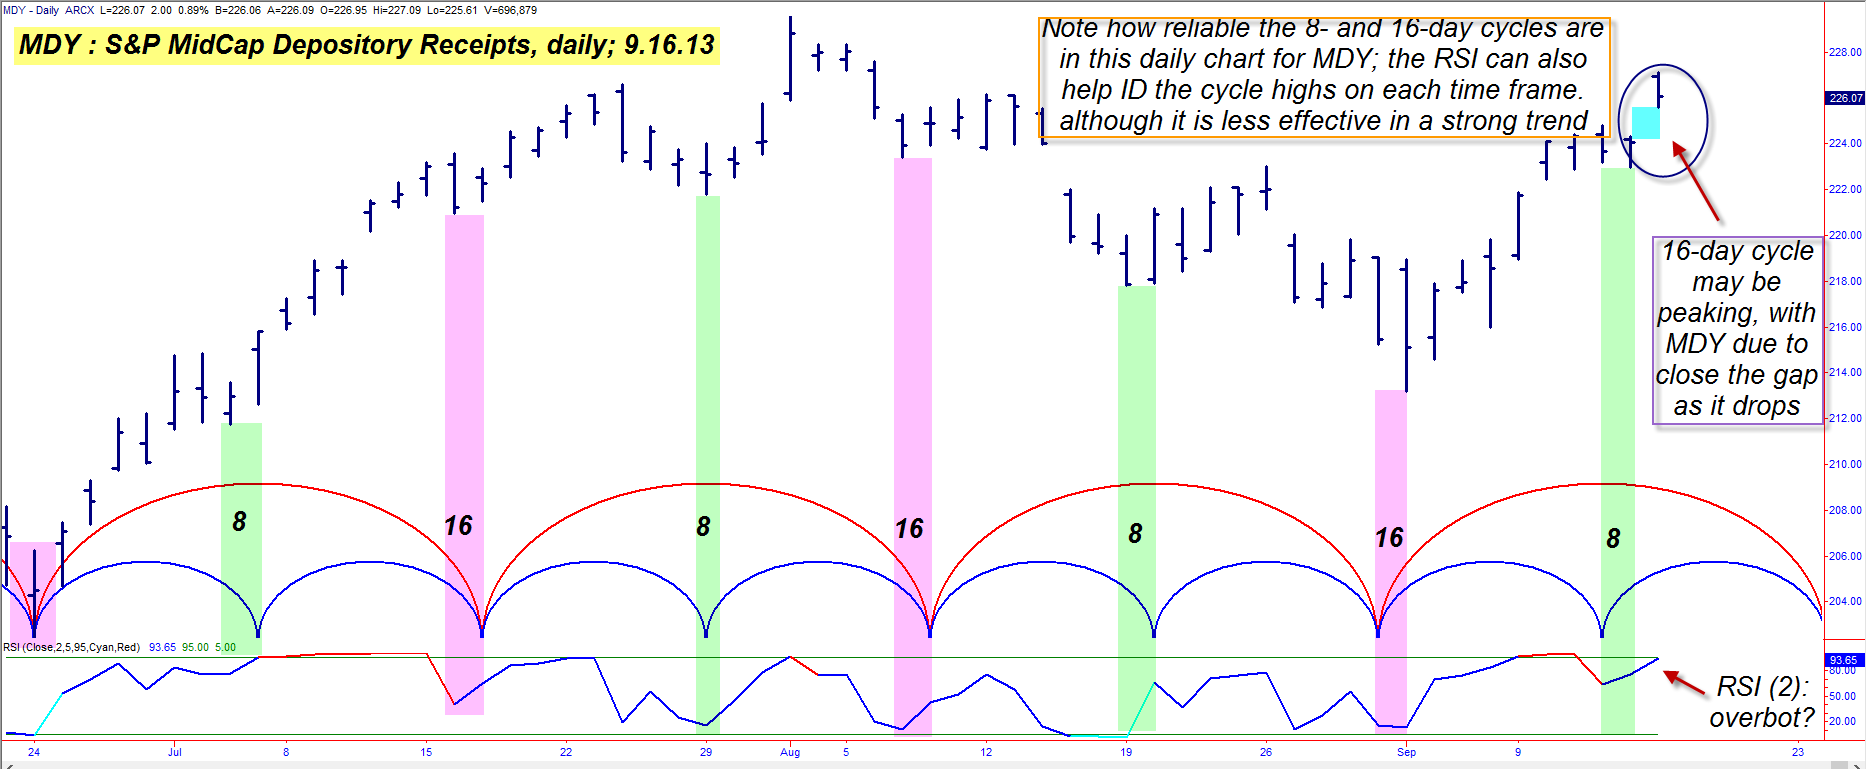
| The science (art?) of identifying cycle highs and lows can be a big assist for traders seeking to capitalize on the regular overbought/oversold episodes that appear in all liquid stocks and exchange traded funds (ETFs). Here's a look at a basic framework for identifying upcoming short-term market turns using the component stocks in the S&P 400 Mid-Cap index, using ETF ticker MDY as a proxy for the index. |
|
| Figure 1. There is a very reliable 8- and 16-day price cycle in the S&P 400 Mid-Cap index; RSI can be used to ID cycle highs and lows but is less accurate during strong trends. |
| Graphic provided by: TradeStation. |
| |
| It's been suggested that identifying a cycle high of a given time period is harder than identifying the cycle lows of the same time series; most cycles traders and analysts measure cycle lengths between significant swing lows, and that does seem to provide the best and most reliable price cycle forecasts. But as long as you do know that a cycle low is already in place, you can still use something as simple as a two-period RSI indicator to see when the ratio of overbought to oversold stocks is at an extreme to help you to anticipate when the next cycle high time/price window will occur. You can also look at the RSI reading of MDY itself as an added confirmation. Now, notice on the chart where an eight-day and a 16-day price cycle has been identified in MDY; this is a long running daily cycle in the S&P 400 index and it is still reliable, with significant swing lows tending to occur within a bar or two of the eight- and 16-day calculation. The latest combined 8/16 day cycle low was made on September 3, 2013 and it's not surprising that we've seen a decent rally in MDY over the past two weeks since Labor day. The eight-day cycle bottomed a day late on September 13, 2013 and as of this morning's session, we've seen MDY gap sharply higher before pulling back, after its RSI reading got over 95.00; what may be happening now is that the 16-day cycle has peaked, with MDY now expected to turn lower through the end of the month. However, the beauty of having identified a repeating set of cycles is that even if MDY decides to rally back toward new highs, you'll still be in position to anticipate the next multicycle low with a high degree of accuracy, with plenty of time to prepare your trading response to such a high-probability market event. Knowing these two simple cycles can also help you to determine when it's time to lock in profits, take some off the table or even when it's a good idea to go flat and back into the safety of cash. |
|
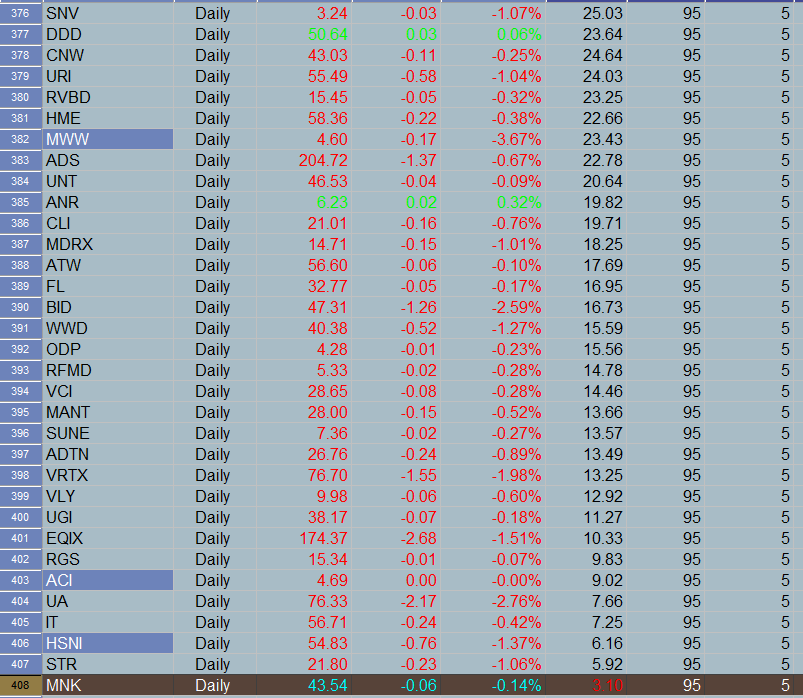
| Figure 2. Of all 400 S&P 400 index component stocks, only one has a 2-day RSI reading below 5.00. Sixty-one stocks have 2-day RSI readings greater than 95.00. Expect a pullback and/or correction to commence soon. |
| Graphic provided by: TradeStation. |
| Graphic provided by: TradeStation Radar Screen. |
| |
| To help confirm the overbought/oversold readings in MDY, you can also plot a list of all S&P 400 component stocks in TradeStation's RadarScreen, noting the ratio of the stocks with two-day RSI readings greater than 95.00 against those with two-day RSI readings less than 5.00. As I write this that ratio is a very large 61 to 1, the highest ratio of overbought to oversold stocks since the rally began two weeks ago. Last Wednesday the ratio was about 38 to 1, so things are getting a bit more extreme; given Monday's bearish intraday reversal after the bullish gap opening, we may very well see this ratio decline substantially over the next few trading sessions, and if a substantial correction is due between now and the next 8/16 cycle low in late September/early October, the ratio may very well be completely reversed, with oversold stocks far outnumbering overbought ones. And thus the cycles and ratios come full circle, with the entire procedure stating anew. |
| This is not a complete trading methodology in and of itself; however, this basic knowledge of the S&P 400 daily 8/16 price cycle and the OB/OS ratio of its component stocks should prove to be a valuable assist as you learn to better time your trade entries, trade management, and trade exit techniques. Trade wisely until we meet here again. |
Freelance financial markets writer and online publisher of the Trendzetterz.com S&P 500 Weekly Forecast service.
| Title: | Market consultant and writer |
| Company: | Trendzetterz |
| Address: | 81 Hickory Hollow Drive |
| Crossville, TN 38555 | |
| Phone # for sales: | 904-303-4814 |
| Website: | trendzetterz.com |
| E-mail address: | support@trendzetterz.com |
Traders' Resource Links | |
| Trendzetterz has not added any product or service information to TRADERS' RESOURCE. | |
Click here for more information about our publications!
Comments

Request Information From Our Sponsors
- VectorVest, Inc.
- Executive Premier Workshop
- One-Day Options Course
- OptionsPro
- Retirement Income Workshop
- Sure-Fire Trading Systems (VectorVest, Inc.)
- Trading as a Business Workshop
- VectorVest 7 EOD
- VectorVest 7 RealTime/IntraDay
- VectorVest AutoTester
- VectorVest Educational Services
- VectorVest OnLine
- VectorVest Options Analyzer
- VectorVest ProGraphics v6.0
- VectorVest ProTrader 7
- VectorVest RealTime Derby Tool
- VectorVest Simulator
- VectorVest Variator
- VectorVest Watchdog
- StockCharts.com, Inc.
- Candle Patterns
- Candlestick Charting Explained
- Intermarket Technical Analysis
- John Murphy on Chart Analysis
- John Murphy's Chart Pattern Recognition
- John Murphy's Market Message
- MurphyExplainsMarketAnalysis-Intermarket Analysis
- MurphyExplainsMarketAnalysis-Visual Analysis
- StockCharts.com
- Technical Analysis of the Financial Markets
- The Visual Investor