HOT TOPICS LIST
- MACD
- Fibonacci
- RSI
- Gann
- ADXR
- Stochastics
- Volume
- Triangles
- Futures
- Cycles
- Volatility
- ZIGZAG
- MESA
- Retracement
- Aroon
INDICATORS LIST
LIST OF TOPICS
PRINT THIS ARTICLE
by Gary Grosschadl
This Canadian international auto parts giant can't beat the important and telling 200-day EMA barrier.
Position: N/A
Gary Grosschadl
Independent Canadian equities trader and technical analyst based in Peterborough
Ontario, Canada.
PRINT THIS ARTICLE
CHART ANALYSIS
Magna International Twice Fails Pullback Test
09/24/02 11:12:53 AMby Gary Grosschadl
This Canadian international auto parts giant can't beat the important and telling 200-day EMA barrier.
Position: N/A
| This is yet another example of the many pullback tests (to the 200-day EMA resistance) we are seeing in the markets these days. Many have been failing these tests with some big exceptions (gold index XAU). |
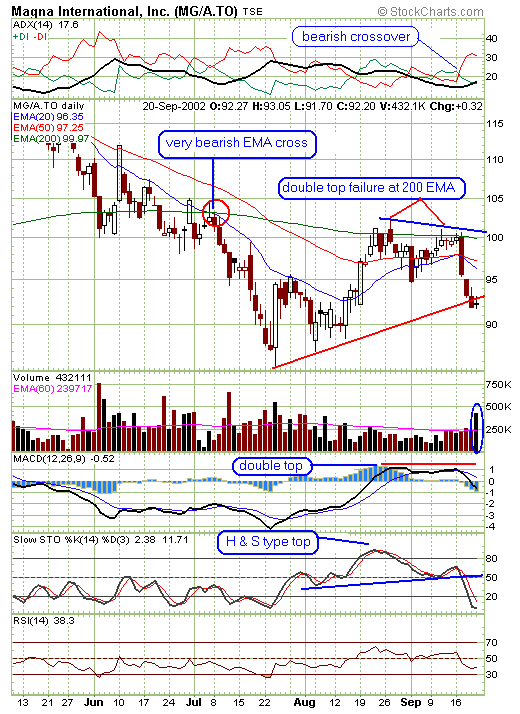
 Figure 1: Daily chart of Magna Intl. Looking back on the daily chart, it shows trouble brewing when in July the 20-day EMA crashed through the much longer term 200-day EMA (always a bad sign). Then after a series of higher lows (red trendline) the stock shows signs of a trend reversal as it managed to rise above its 20-day EMA resistance. This set up the pullback test to the ever potent 200-day EMA barrier. Brief failure there set up yet another test and this one also failed in the form of a double top. This was a swift decline as traders seen the danger here and in the overall indices. By measurement the double top correction could find initial support 5-7 points below the 95 support trough, as a guideline. An interesting note are the confirming patterns (double top and head and shoulders) also detected in the displayed indicators MACD and stochastics |

|
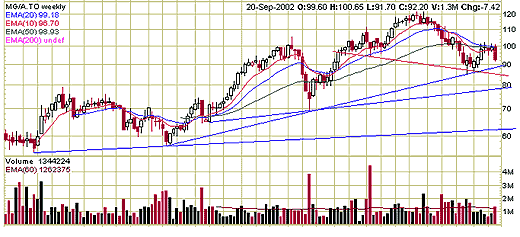
| Figure 2: Weekly chart of Magna Intl. |
| Graphic provided by: stockcharts.com. |
| |
| The candle pattern is a harami cross hinting at a lessening of bearish power but the large volume spike could indicate otherwise so confirmation of the next day's candle/price action is required. A move down validates the trendline violation making it more bearish. Checking the weekly chart there are three possible lower trendline supports - 90/85/78 should a downleg continue. Look for a bounce there. Failure at the 85 level on the weekly chart is arguably a slanted head and shoulder failure, something to watch for if conditions worsen now or in the future. |
| There is not much doubt that this stock like many others will take its cue from movement in the overall indices. A rally in the big indices will likely result in another assault towards the 200-day EMA. More downward pressure will lead us towards those trendline supports as outlined. |
Independent Canadian equities trader and technical analyst based in Peterborough
Ontario, Canada.
| Website: | www.whatsonsale.ca/financial.html |
| E-mail address: | gwg7@sympatico.ca |
Click here for more information about our publications!
PRINT THIS ARTICLE

Request Information From Our Sponsors
- StockCharts.com, Inc.
- Candle Patterns
- Candlestick Charting Explained
- Intermarket Technical Analysis
- John Murphy on Chart Analysis
- John Murphy's Chart Pattern Recognition
- John Murphy's Market Message
- MurphyExplainsMarketAnalysis-Intermarket Analysis
- MurphyExplainsMarketAnalysis-Visual Analysis
- StockCharts.com
- Technical Analysis of the Financial Markets
- The Visual Investor
- VectorVest, Inc.
- Executive Premier Workshop
- One-Day Options Course
- OptionsPro
- Retirement Income Workshop
- Sure-Fire Trading Systems (VectorVest, Inc.)
- Trading as a Business Workshop
- VectorVest 7 EOD
- VectorVest 7 RealTime/IntraDay
- VectorVest AutoTester
- VectorVest Educational Services
- VectorVest OnLine
- VectorVest Options Analyzer
- VectorVest ProGraphics v6.0
- VectorVest ProTrader 7
- VectorVest RealTime Derby Tool
- VectorVest Simulator
- VectorVest Variator
- VectorVest Watchdog
