

HOT TOPICS LIST
- MACD
- Fibonacci
- RSI
- Gann
- ADXR
- Stochastics
- Volume
- Triangles
- Futures
- Cycles
- Volatility
- ZIGZAG
- MESA
- Retracement
- Aroon
INDICATORS LIST
LIST OF TOPICS
PRINT THIS ARTICLE
by Billy Williams
ULTA has recently emerged from its deep sleep and could have major repercussions for the rest of the market.
Position: Buy
Billy Williams
Billy Williams has been trading the markets for 27 years, specializing in momentum trading with stocks and options.
PRINT THIS ARTICLE
TECHNICAL ANALYSIS
ULTA Emerging From Sleep
09/16/13 03:56:22 PMby Billy Williams
ULTA has recently emerged from its deep sleep and could have major repercussions for the rest of the market.
Position: Buy
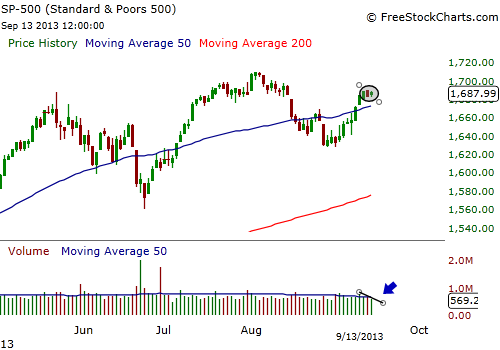
| The market has been sluggish the last few days, trading on lower volume and in a tight range for three days straight now (Figure 1). Friday's trading action resulted in an inside trading bar which could also be classified as a narrow range bar, an indicator of low volatility, which could be of major significance in the coming trading days. The reason for its importance is that with the market trading sluggishly in the previous days followed by an inside bar/narrow range bar is that low volatility is followed by high volatility and vice versa. The market has been under a lot of downward pressure by the bears and has spent the latter part of the summer working its way out of a steep decline that began and ended in August. August also signaled that the "summer doldrums", a seasonal pattern highlighted by low volume trading, was coming to end. The ending of the summer doldrums holds the potential that the market might be able to shake off the bear's hold and give hope to the bulls in that the market may trade higher. |
|
| Figure 1. The last three trading days has resulted in Friday forming an inside bar as well as being a narrow range bar. This is a low volatility signal which could mean the SPX is going to breakout higher, taking stocks with it. |
| Graphic provided by: www.freestockcharts.com. |
| |
| Despite the low-volume trading and the August decline, the overall market has remained technically strong by staying above its 50-day and 200-day simple moving averages (SMA's). More important, the two SMA's are trading in proper context with one another — the 50-day SMA above the 200-day SMA in bullish symmetry to one another. With these positive technicals taking place, it begets the question "what next and, how do you profit from it?" With the market appearing that it wants to breakout to higher ground, you first have to look at emerging stock leadership that has been in a base pattern and see how they are reacting. This is because stock leadership tends to lead the market so while every trader is waiting to see what happens in the major indexes like the SPX, you want to get a jump on the rest of them by looking for positive bullish price action in emerging stock leadership. |
|
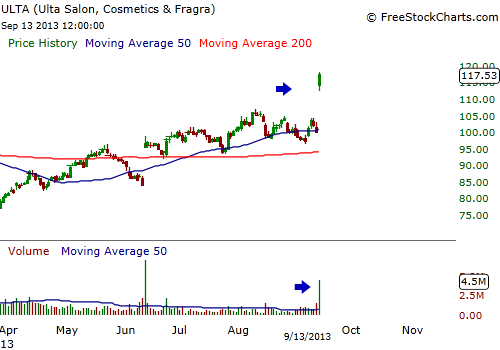
| Figure 2. On Friday, ULTA broke out through resistance on huge volume which could indicate that stock leadership is already moving higher ahead of the SPX and major indexes. |
| Graphic provided by: www.freestockcharts.com. |
| |
| ULTA is a cosmetic company that has been in a first stage base pattern for almost 15 months and kept running into resistance at the $103-104 price level (Figure 2). The stock had a scary moment earlier this year in March when it broke support at the $78 price level, trading below the $73 price level, but managed to recover back to its old highs over the next several months. Friday, ULTA broke out on volume of almost 500% of its 50-day average, shattering upward resistance and is firmly in bullish territory. ULTA wasn't the only stock to breakout on Friday with stocks like NQ Mobile (NQ) also resuming its upward move on stronger volume to new all-time price highs, along with several others. |
| The point is that now stock leadership is emerging ahead of the overall market and as major indexes are forming compelling bullish technicals, other breakout moves could follow suit. For ULTA, the stock has broken out too high, too fast so it's better to wait for the stock to pull back a little and get a better entry. Wait for price to pull back on lower volume and enter as it resumes its upward move. As always set a stop loss upon entry, usually no more than 7% from your entry point. |
Billy Williams has been trading the markets for 27 years, specializing in momentum trading with stocks and options.
| Company: | StockOptionSystem.com |
| E-mail address: | stockoptionsystem.com@gmail.com |
Traders' Resource Links | |
| StockOptionSystem.com has not added any product or service information to TRADERS' RESOURCE. | |
Click here for more information about our publications!
Comments

Request Information From Our Sponsors
- VectorVest, Inc.
- Executive Premier Workshop
- One-Day Options Course
- OptionsPro
- Retirement Income Workshop
- Sure-Fire Trading Systems (VectorVest, Inc.)
- Trading as a Business Workshop
- VectorVest 7 EOD
- VectorVest 7 RealTime/IntraDay
- VectorVest AutoTester
- VectorVest Educational Services
- VectorVest OnLine
- VectorVest Options Analyzer
- VectorVest ProGraphics v6.0
- VectorVest ProTrader 7
- VectorVest RealTime Derby Tool
- VectorVest Simulator
- VectorVest Variator
- VectorVest Watchdog
- StockCharts.com, Inc.
- Candle Patterns
- Candlestick Charting Explained
- Intermarket Technical Analysis
- John Murphy on Chart Analysis
- John Murphy's Chart Pattern Recognition
- John Murphy's Market Message
- MurphyExplainsMarketAnalysis-Intermarket Analysis
- MurphyExplainsMarketAnalysis-Visual Analysis
- StockCharts.com
- Technical Analysis of the Financial Markets
- The Visual Investor