

HOT TOPICS LIST
- MACD
- Fibonacci
- RSI
- Gann
- ADXR
- Stochastics
- Volume
- Triangles
- Futures
- Cycles
- Volatility
- ZIGZAG
- MESA
- Retracement
- Aroon
INDICATORS LIST
LIST OF TOPICS
PRINT THIS ARTICLE
by Matt Blackman
As the most recent rally has gathered steam, a number of sectors have put in strong performances including semiconductors. This semi looks particularly interesting.
Position: N/A
Matt Blackman
Matt Blackman is a full-time technical and financial writer and trader. He produces corporate and financial newsletters, and assists clients in getting published in the mainstream media. He is the host of TradeSystemGuru.com. Matt has earned the Chartered Market Technician (CMT) designation. Find out what stocks and futures Matt is watching on Twitter at www.twitter.com/RatioTrade
PRINT THIS ARTICLE
ROUND TOP & BOTTOM
Is It Time To Buy Cirrus Logic?
09/16/13 03:48:38 PMby Matt Blackman
As the most recent rally has gathered steam, a number of sectors have put in strong performances including semiconductors. This semi looks particularly interesting.
Position: N/A
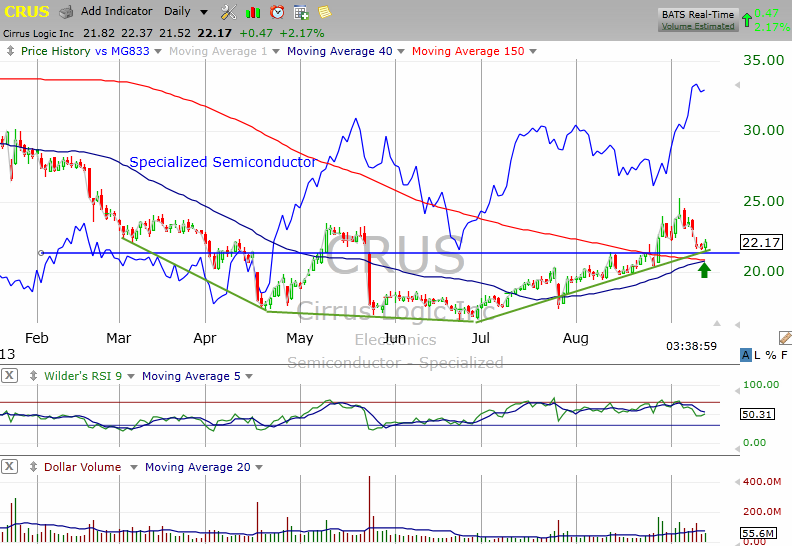
| In a recent "high fliers" scan on TC2000, specialized semiconductor maker Cirrus Logic (CRUS) came up after making an impressive 2.1% move on the day. A quick look at the chart in Figure 1 showed a powerful saucer bottom chart pattern in the process of building (see green lines). The stock also showed good support at $21.45. In late August CRUS saw its 40-day moving average (MA) cross above the 150-day MA, which is another positive technical sign. |
|
| Figure 1 � Daily chart of Cirrus Logic showing the saucer bottom chart pattern and support at $21.45. The stock has also recently broken above its 40- and 150-day moving averages. |
| Graphic provided by: TC2000.com. |
| |
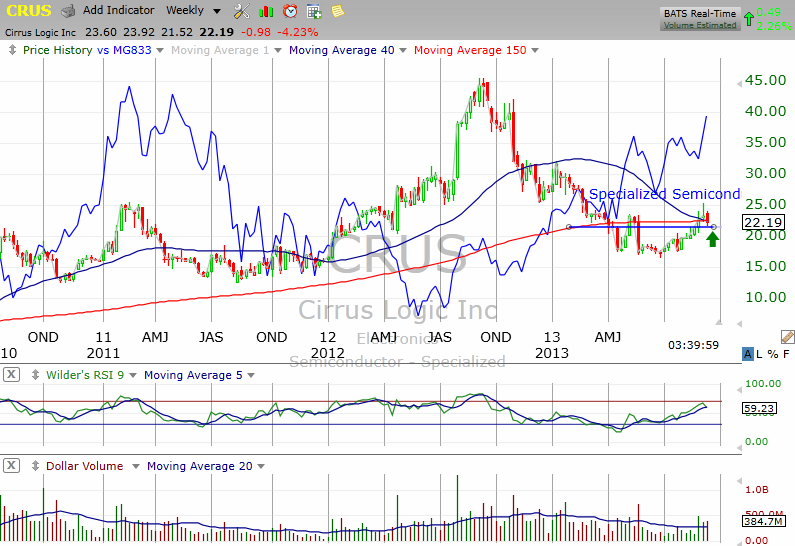
| The Specialized Semiconductor industry also looks positive on the weekly chart (Figure 2). From a revenue and earnings perspective, CRUS has a P/E of 9.8, has seen an EPS change of +210% in the latest quarter, and an EPS change over the past year of +75%, according to TC2000.com. Revenue growth for the last four quarters is 100%. According to Comtex, CRUS has the second highest revenue per employee in the semiconductor industry of $1.4 million. |
|
| Figure 2 � Weekly chart of Cirrus Logic and Specialized Semiconductors show the recent move in the context of a longer time frame. |
| Graphic provided by: TC2000.com. |
| |
| As the chart in Figure 3 shows, CRUS has been volatile over the last two years as have Specialized Semiconductors but CRUS looks to have lagged the recent industry upturn. |
|
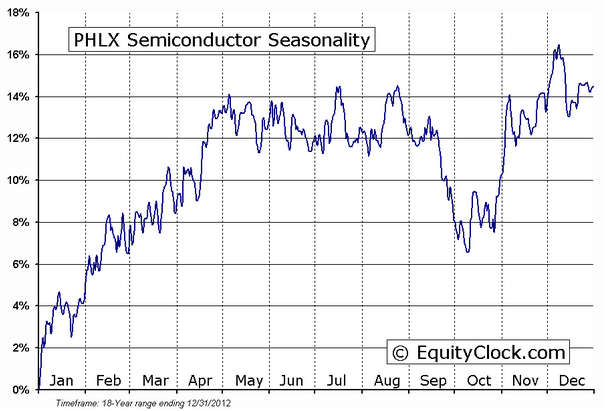
| Figure 3 � Composite performance of the Philadelphia Semiconductor sector over the last 18 years showing early year strength followed by another period of strength in the final quarter. |
| Graphic provided by: www.EquityClock.com. |
| |
| From a seasonal perspective, September has typically been a weak month for semiconductors but after bottoming in October, the industry has traditionally been strong into year-end according to EquityClock.com. |
| High powered traders like Dan Zanger look for companies with a combination of strong earnings growth combined with compelling chart patterns, and this chart looks like it qualifies on both fronts. |
Matt Blackman is a full-time technical and financial writer and trader. He produces corporate and financial newsletters, and assists clients in getting published in the mainstream media. He is the host of TradeSystemGuru.com. Matt has earned the Chartered Market Technician (CMT) designation. Find out what stocks and futures Matt is watching on Twitter at www.twitter.com/RatioTrade
| Company: | TradeSystemGuru.com |
| Address: | Box 2589 |
| Garibaldi Highlands, BC Canada | |
| Phone # for sales: | 604-898-9069 |
| Fax: | 604-898-9069 |
| Website: | www.tradesystemguru.com |
| E-mail address: | indextradermb@gmail.com |
Traders' Resource Links | |
| TradeSystemGuru.com has not added any product or service information to TRADERS' RESOURCE. | |
Click here for more information about our publications!
PRINT THIS ARTICLE

Request Information From Our Sponsors
- VectorVest, Inc.
- Executive Premier Workshop
- One-Day Options Course
- OptionsPro
- Retirement Income Workshop
- Sure-Fire Trading Systems (VectorVest, Inc.)
- Trading as a Business Workshop
- VectorVest 7 EOD
- VectorVest 7 RealTime/IntraDay
- VectorVest AutoTester
- VectorVest Educational Services
- VectorVest OnLine
- VectorVest Options Analyzer
- VectorVest ProGraphics v6.0
- VectorVest ProTrader 7
- VectorVest RealTime Derby Tool
- VectorVest Simulator
- VectorVest Variator
- VectorVest Watchdog
- StockCharts.com, Inc.
- Candle Patterns
- Candlestick Charting Explained
- Intermarket Technical Analysis
- John Murphy on Chart Analysis
- John Murphy's Chart Pattern Recognition
- John Murphy's Market Message
- MurphyExplainsMarketAnalysis-Intermarket Analysis
- MurphyExplainsMarketAnalysis-Visual Analysis
- StockCharts.com
- Technical Analysis of the Financial Markets
- The Visual Investor