

HOT TOPICS LIST
- MACD
- Fibonacci
- RSI
- Gann
- ADXR
- Stochastics
- Volume
- Triangles
- Futures
- Cycles
- Volatility
- ZIGZAG
- MESA
- Retracement
- Aroon
INDICATORS LIST
LIST OF TOPICS
PRINT THIS ARTICLE
by Donald W. Pendergast, Jr.
Price cycle and money flow analysis both agree that the S&P 500 may be due for another correction soon.
Position: N/A
Donald W. Pendergast, Jr.
Freelance financial markets writer and online publisher of the Trendzetterz.com S&P 500 Weekly Forecast service.
PRINT THIS ARTICLE
CYCLES
S&P 500 Index Preparing For Sell-Off?
09/13/13 03:33:53 PMby Donald W. Pendergast, Jr.
Price cycle and money flow analysis both agree that the S&P 500 may be due for another correction soon.
Position: N/A
| Since making a generational low back in March 2009, the S&P 500 index (.SPX) is up by more than 150%, proving to be the best place for investment capital to have been deployed (compared to most commodity and real estate markets, not to mention the bond market or insured savings accounts) since early 2009. Of course now that "everyone" also knows this to be true, it's inevitable that a bull market high will be in place sooner rather than later, with the latecomers to the party being the ones most rudely separated from their trading/investing capital. |
|
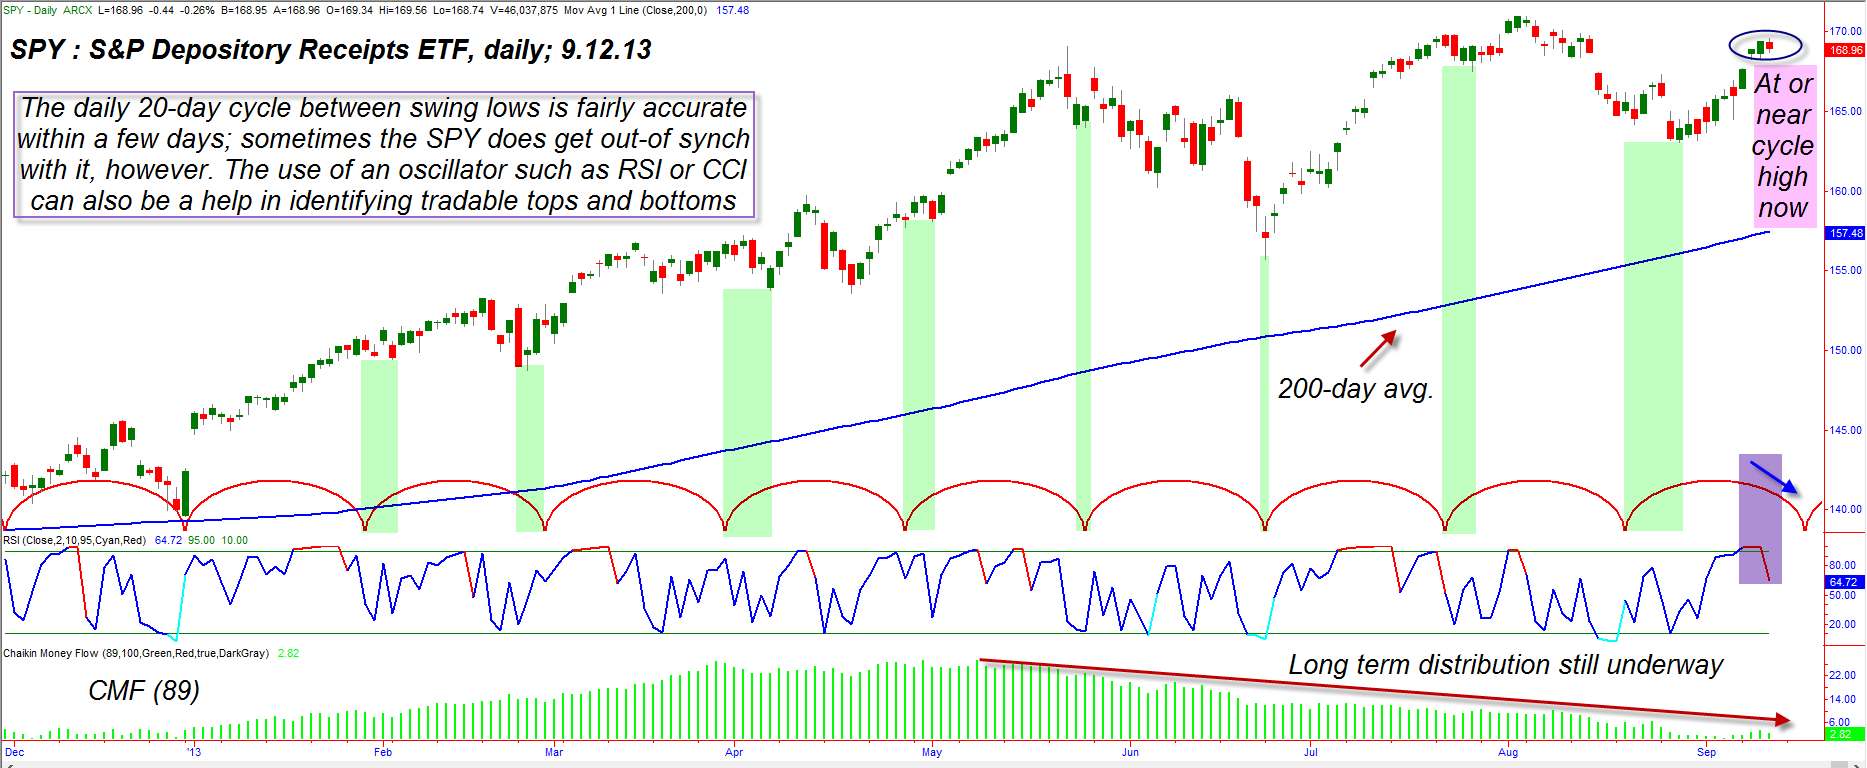
| Figure 1. The 20-day cycle between swing lows still works well in the S&P 500 index; here you see it at work in its ETF proxy, SPY. The next 20-day cycle low is expected by late September or early October 2013. |
| Graphic provided by: TradeStation. |
| |
| Here are some interesting dynamics that suggest we are very close to another 20/40 day cycle high in the .SPX, using SPY as a proxy (See Figure 1): 1. The most frightening evidence that a near-term high and a long-term bull market high is at hand is the heavy distribution pattern depicted by the Chaikin money flow histogram (CMF)(89). Bottom line; the "smart money" has been using the last few rallies to lighten up on their long-term holdings in this market. 2. The reliable 20-day and 40-day price cycles (note how accurate the timing window has been on the 20-day cycle — see the vertical green shaded areas) are now suggesting that the 20-day cycle has already peaked, with the 40-day cycle due to peak within the next seven to 10 trading sessions. 3. The two-day RSI indicator has already begun to decline after peaking with a reading of 99.57 on Wednesday. 4. The Volatility Index or .VIX (not shown and which normally moves in the inverse direction of the .SPX) has also put in a double bottom on its daily chart and is starting to rise again as market worries begin to increase somewhat. |
|
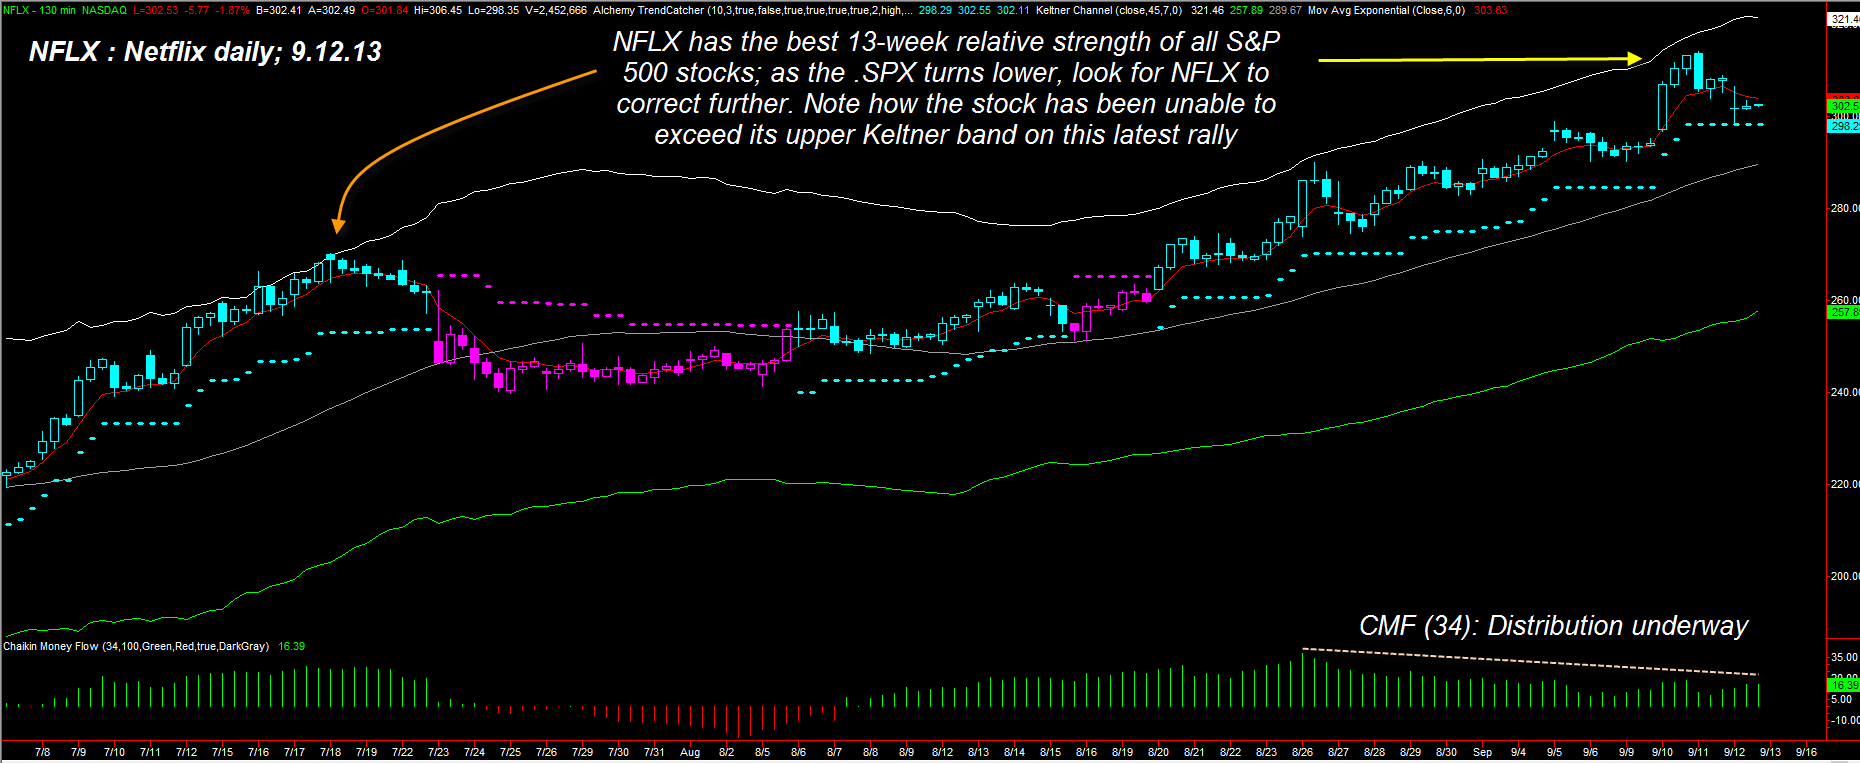
| Figure 2. Netflix (NFLX) has been a very strong performer of late; note, however that the stock is gradually losing upward momentum, failing to exceed its upper Keltner channel on the recent rally. The money flow trend shows a clear distribution pattern, too. |
| Graphic provided by: TradeStation. |
| Graphic provided by: Trading Alchemy's Trend Catcher. |
| |
| If you look to the right on the price cycle plots, you can see that the next 20-day cycle low in the .SPX is due near the end of September or possibly early October 2013. A daily close back below 168.35 will give credence to the case for an already complete 20-day cycle high; conversely, a break above (and daily close above) 169.40 might be suggesting that the 40-day cycle still has some work to do until it finally peaks — with the result being the potential for a new high in the .SPX before the correction takes hold. The potential for a sharp correction is already in place however — as previously mentioned — and then when you add in the current worries about Syria, a budget-induced government shutdown and a slacking off of Fed bond purchases (the so-called "tapering" event), any daily close back below 168.35 and then a closing of the latest bullish gap would seem to be sending a bearish signal indeed. |
| If you're currently long SPY or a group of stocks that are closely correlated to the daily price movements of the .SPX, make sure you have either a protective put strategy or exit plan already in place — see the daily chart for Netfix (NFLX) in Figure 2 for a view of a stock in danger of near-term profit taking. If you're out of the market altogether, simply sit in cash, waiting for the next 20- or 40-day cycle low to be put in; if such a low takes place above the 200-day moving average (blue line) the odds are good that you'll see a tradable rally coming out of those future cycle lows. Make sure you only buy the strongest relative strength large cap stocks (based on their four- or 13-week performance vs. the .SPX) that have a solid trend of quarterly earnings surprises, using an objective mechanical trigger to initiate your trades something like a two-day RSI or a CCI indicator. Keep your per trade risks at 1% or so and never let your stock portfolio have more than 5% total account risk at any given time and you'll be able to profit from such regular cycle lows in the .SPX over the long haul. Trade wisely until we meet here again. |
Freelance financial markets writer and online publisher of the Trendzetterz.com S&P 500 Weekly Forecast service.
| Title: | Market consultant and writer |
| Company: | Trendzetterz |
| Address: | 81 Hickory Hollow Drive |
| Crossville, TN 38555 | |
| Phone # for sales: | 904-303-4814 |
| Website: | trendzetterz.com |
| E-mail address: | support@trendzetterz.com |
Traders' Resource Links | |
| Trendzetterz has not added any product or service information to TRADERS' RESOURCE. | |
Click here for more information about our publications!
PRINT THIS ARTICLE

Request Information From Our Sponsors
- StockCharts.com, Inc.
- Candle Patterns
- Candlestick Charting Explained
- Intermarket Technical Analysis
- John Murphy on Chart Analysis
- John Murphy's Chart Pattern Recognition
- John Murphy's Market Message
- MurphyExplainsMarketAnalysis-Intermarket Analysis
- MurphyExplainsMarketAnalysis-Visual Analysis
- StockCharts.com
- Technical Analysis of the Financial Markets
- The Visual Investor
- VectorVest, Inc.
- Executive Premier Workshop
- One-Day Options Course
- OptionsPro
- Retirement Income Workshop
- Sure-Fire Trading Systems (VectorVest, Inc.)
- Trading as a Business Workshop
- VectorVest 7 EOD
- VectorVest 7 RealTime/IntraDay
- VectorVest AutoTester
- VectorVest Educational Services
- VectorVest OnLine
- VectorVest Options Analyzer
- VectorVest ProGraphics v6.0
- VectorVest ProTrader 7
- VectorVest RealTime Derby Tool
- VectorVest Simulator
- VectorVest Variator
- VectorVest Watchdog