

HOT TOPICS LIST
- MACD
- Fibonacci
- RSI
- Gann
- ADXR
- Stochastics
- Volume
- Triangles
- Futures
- Cycles
- Volatility
- ZIGZAG
- MESA
- Retracement
- Aroon
INDICATORS LIST
LIST OF TOPICS
PRINT THIS ARTICLE
by Chaitali Mohile
Basic Materials iShares ETF is likely to drain down.
Position: N/A
Chaitali Mohile
Active trader in the Indian stock markets since 2003 and a full-time writer. Trading is largely based upon technical analysis.
PRINT THIS ARTICLE
CHART ANALYSIS
IYM In Converging Range
09/13/13 03:26:11 PMby Chaitali Mohile
Basic Materials iShares ETF is likely to drain down.
Position: N/A
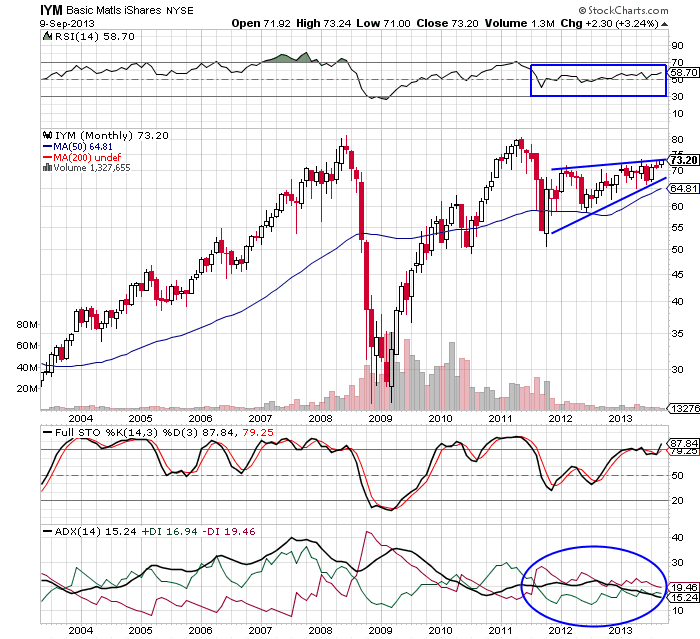
| Basic Materials iShares (IYM) has clearly been in a bearish trend and although it looks like it is recovering, signs point to more downward pressure. After establishing support at 50 levels, the index moved upwards, forming higher lows and higher highs. Since early 2012, IYM has been moving in the tapering range on weak notes. The index formed a long-term rising wedge — a bearish reversal pattern — on the monthly time frame chart in Figure 1. The two converging trendlines formed by the series of higher highs and higher lows are likely to intersect soon, resulting in a bearish breakout of IYM. |
|
| Figure 1: Monthly chart for IYM. |
| Graphic provided by: StockCharts.com. |
| |
| This weakness would further narrow the trading range of IYM. The relative strength index (RSI)(14) is ranging in the bullish area between 50 and 70 and the full stochastic(14,3,3) is near an overbought region. These conditions would add volatility in the converging range. Look for IYM to breach the lower trendline support as well as the ascending 50-day moving average (MA) support. |
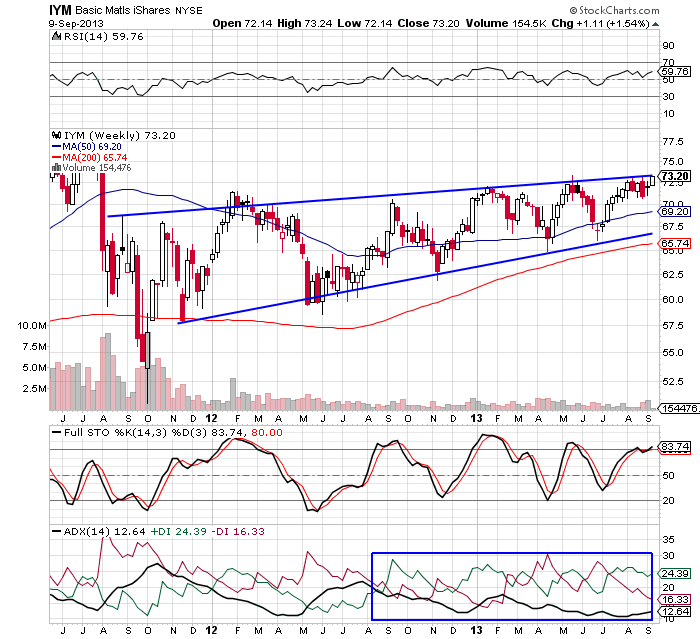
| On the weekly time frame chart in Figure 2, IYM is moving comfortably within the two converging trendlines. These support-resistance lines have offered short-term buying and selling opportunities to traders. In the past year and a half, IYM has respected both trendlines. Due to the weak trend indicated by the ADX(14), the index could not violate either of the trendlines. |
| The buying pressure (green line) and selling pressure (red line) of the trend indicator are converging frequently with the ADX line below 15 levels. This suggests high volatility and directionless rally for IYM. In addition, the RSI(14) and the stochastic oscillator are zigzagging in an oversold and overbought region. Therefore, IYM is likely to continue its rally within the wedge till a strong bearish pressure is developed. |
|
| Figure 2: Weekly chart for IYM. |
| Graphic provided by: StockCharts.com. |
| |
| Currently, IYM is ready to retrace once again toward its lower trendline support. Although the distance is short, traders can take advantage of this trading opportunity for a short time with the target of the trendline and the 200-day moving average (MA) support. Look for the index to keep on shifting from lower to upper trendlines till the rising wedge formation matures and initiates a bearish breakout. To conclude, IYM is forming a long-term rising wedge pattern which could break downward in the near future. |
Active trader in the Indian stock markets since 2003 and a full-time writer. Trading is largely based upon technical analysis.
| Company: | Independent |
| Address: | C1/3 Parth Indraprasth Towers. Vastrapur |
| Ahmedabad, Guj 380015 | |
| E-mail address: | chaitalimohile@yahoo.co.in |
Traders' Resource Links | |
| Independent has not added any product or service information to TRADERS' RESOURCE. | |
Click here for more information about our publications!
PRINT THIS ARTICLE

Request Information From Our Sponsors
- StockCharts.com, Inc.
- Candle Patterns
- Candlestick Charting Explained
- Intermarket Technical Analysis
- John Murphy on Chart Analysis
- John Murphy's Chart Pattern Recognition
- John Murphy's Market Message
- MurphyExplainsMarketAnalysis-Intermarket Analysis
- MurphyExplainsMarketAnalysis-Visual Analysis
- StockCharts.com
- Technical Analysis of the Financial Markets
- The Visual Investor
- VectorVest, Inc.
- Executive Premier Workshop
- One-Day Options Course
- OptionsPro
- Retirement Income Workshop
- Sure-Fire Trading Systems (VectorVest, Inc.)
- Trading as a Business Workshop
- VectorVest 7 EOD
- VectorVest 7 RealTime/IntraDay
- VectorVest AutoTester
- VectorVest Educational Services
- VectorVest OnLine
- VectorVest Options Analyzer
- VectorVest ProGraphics v6.0
- VectorVest ProTrader 7
- VectorVest RealTime Derby Tool
- VectorVest Simulator
- VectorVest Variator
- VectorVest Watchdog