HOT TOPICS LIST
- MACD
- Fibonacci
- RSI
- Gann
- ADXR
- Stochastics
- Volume
- Triangles
- Futures
- Cycles
- Volatility
- ZIGZAG
- MESA
- Retracement
- Aroon
INDICATORS LIST
LIST OF TOPICS
PRINT THIS ARTICLE
by Koos van der Merwe
J&J is well known for its baby powder and other baby products. In recent years, they have had to recall many of their products. Are they worth a buy?
Position: Buy
Koos van der Merwe
Has been a technical analyst since 1969, and has worked as a futures and options trader with First Financial Futures in Johannesburg, South Africa.
PRINT THIS ARTICLE
ELLIOTT WAVE
Johnson & Johnson
09/12/13 05:17:49 PMby Koos van der Merwe
J&J is well known for its baby powder and other baby products. In recent years, they have had to recall many of their products. Are they worth a buy?
Position: Buy
| They have had their fair share of recalls, lawsuits, and fines. Are these problems a norm for pharmaceutical companies, or is J&J a problem company? When you look at the balance sheet of the company, everything looks fine. In other words, the company is showing excellence in recalling products that it believes may be harmful to the patient. It has proved itself as a company with a conscience. |

|
| Figure 1. Monthly chart of Johnson and Johnson. |
| Graphic provided by: AdvancedGET. |
| |
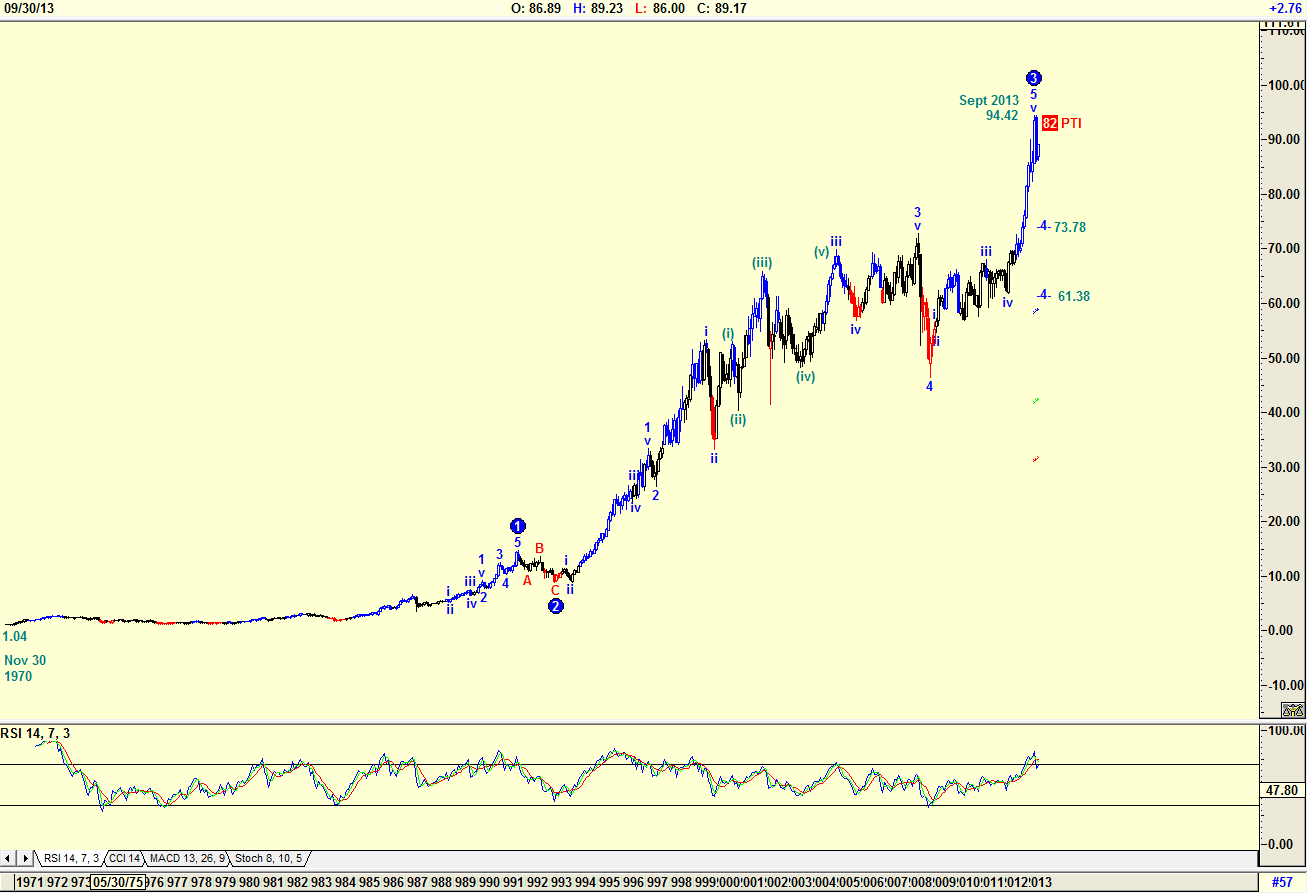
| The chart in Figure 1 is a monthly chart. Over the years, J&J has had a 2:1 split numerous times, so the chart shows how the price in November 1970 was $1.04 rising to a high of $94.42 in September 2013, an excellent return for those investment companies that buy and hold. The Advanced GET Elliott Wave count is suggesting that the price is completing a WAVE 3 count with a correction in a WAVE 4 to $73.78 or $61.38. The PTI (Probability Index) of 82% is high and the RSI indicator at overbought levels is confirming this possibility. |

|
| Figure 2. Daily chart of Johnson and Johnson showing an RSI BUY. |
| Graphic provided by: AdvancedGET. |
| |
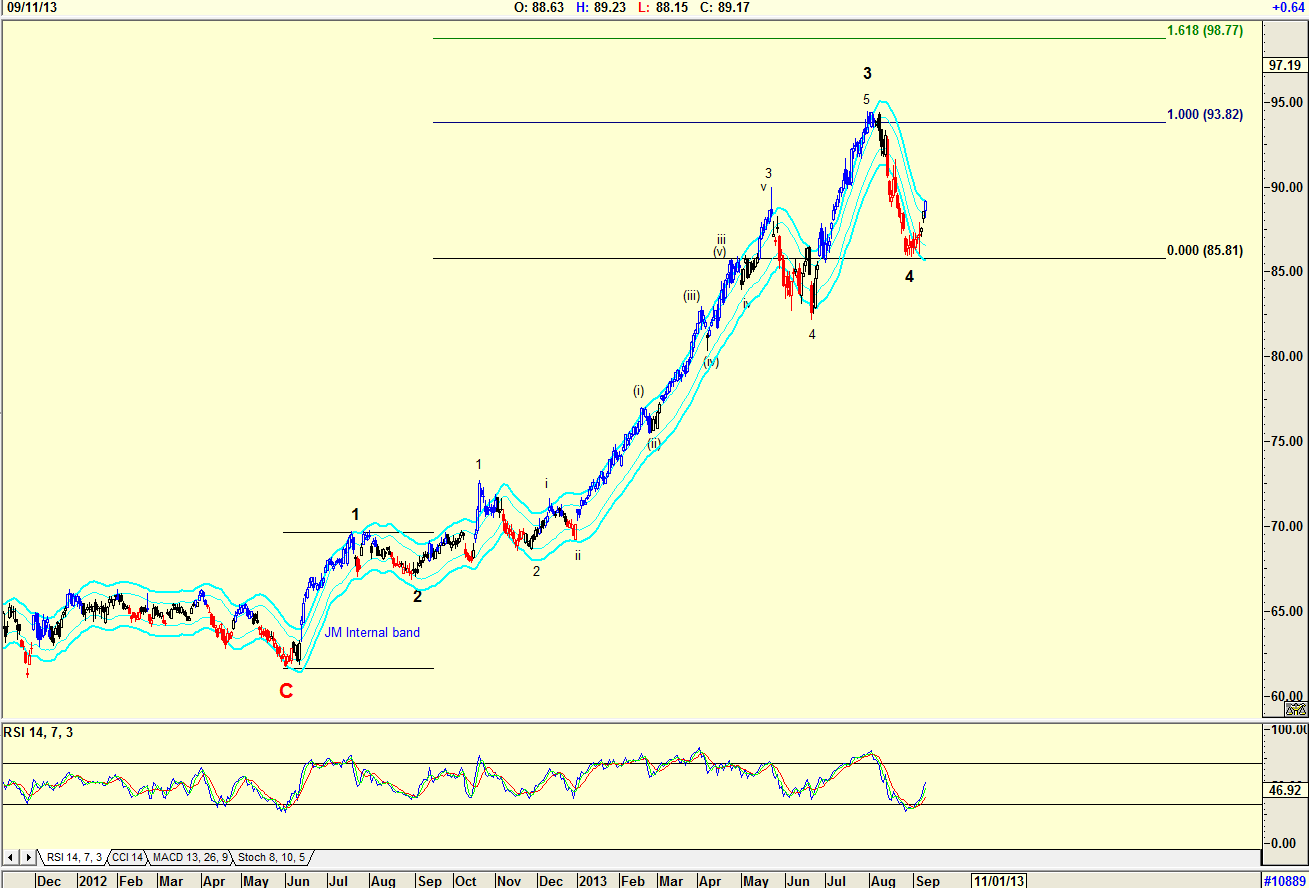
| The daily chart in Figure 2 shows an Elliott Wave count suggesting that the price could rise from its present level to either $93.82 or $98.77. The RSI indicator is confirming that the trend is up. The JM Internal Band shows the price testing the upper band. A break above the upper band will confirm a buy. The JM Internal Band indicator is 15-period simple moving average offset by 2% positive and 2% negative. A move above the upper band is a buy and a move below the lower band is a short sell. I am a buyer of J&J at current levels, but because it is in a WAVE 5, I will keep my stops close, especially as the price reaches the $93.82 level. |
Has been a technical analyst since 1969, and has worked as a futures and options trader with First Financial Futures in Johannesburg, South Africa.
| Address: | 3256 West 24th Ave |
| Vancouver, BC | |
| Phone # for sales: | 6042634214 |
| E-mail address: | petroosp@gmail.com |
Click here for more information about our publications!
PRINT THIS ARTICLE

Request Information From Our Sponsors
- VectorVest, Inc.
- Executive Premier Workshop
- One-Day Options Course
- OptionsPro
- Retirement Income Workshop
- Sure-Fire Trading Systems (VectorVest, Inc.)
- Trading as a Business Workshop
- VectorVest 7 EOD
- VectorVest 7 RealTime/IntraDay
- VectorVest AutoTester
- VectorVest Educational Services
- VectorVest OnLine
- VectorVest Options Analyzer
- VectorVest ProGraphics v6.0
- VectorVest ProTrader 7
- VectorVest RealTime Derby Tool
- VectorVest Simulator
- VectorVest Variator
- VectorVest Watchdog
- StockCharts.com, Inc.
- Candle Patterns
- Candlestick Charting Explained
- Intermarket Technical Analysis
- John Murphy on Chart Analysis
- John Murphy's Chart Pattern Recognition
- John Murphy's Market Message
- MurphyExplainsMarketAnalysis-Intermarket Analysis
- MurphyExplainsMarketAnalysis-Visual Analysis
- StockCharts.com
- Technical Analysis of the Financial Markets
- The Visual Investor
