HOT TOPICS LIST
- MACD
- Fibonacci
- RSI
- Gann
- ADXR
- Stochastics
- Volume
- Triangles
- Futures
- Cycles
- Volatility
- ZIGZAG
- MESA
- Retracement
- Aroon
INDICATORS LIST
LIST OF TOPICS
PRINT THIS ARTICLE
by Donald W. Pendergast, Jr.
Shares of Apple Computer recently enjoyed a nice two-month rally, surging higher by more than 30%; however, Wednesday's bearish gap is suggesting that the party is officially over.
Position: N/A
Donald W. Pendergast, Jr.
Freelance financial markets writer and online publisher of the Trendzetterz.com S&P 500 Weekly Forecast service.
PRINT THIS ARTICLE
GAPS
Apple Computer : Sudden Sell-Off; More Losses Ahead?
09/12/13 05:14:04 PMby Donald W. Pendergast, Jr.
Shares of Apple Computer recently enjoyed a nice two-month rally, surging higher by more than 30%; however, Wednesday's bearish gap is suggesting that the party is officially over.
Position: N/A
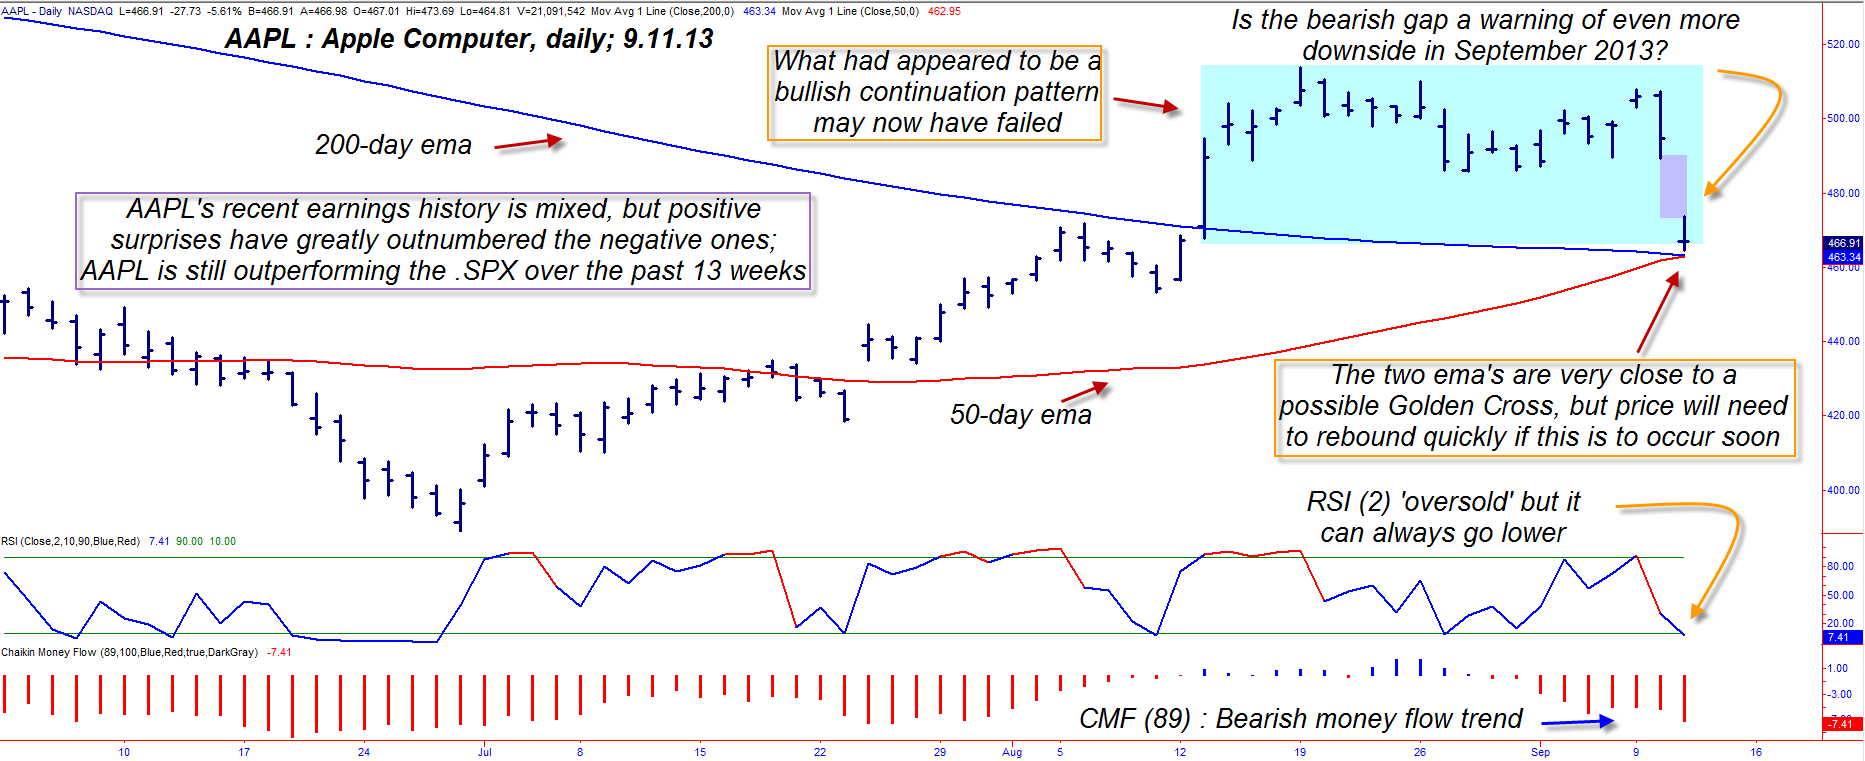
| Apple Computer shares soared nearly nine-fold between early 2009 and late 2012, finally topping out at 705.07 on September 21, 2012. The high-flying stock then proceeded to plummet by nearly 45% during the next nine months, finally finding support after going as low as 388.87. That late June 2013 low was of a multi price cycle variety, so the strength of the subsequent rally wasn't all that surprising; what is surprising now, however, is the sudden appearance of a bearish gap — one that isn't related to a quarterly earnings report. Here's a closer look at the many conflicting technical and fundamental dynamics that are at work on AAPL's daily price chart (Figure 1). |

|
| Figure 1. Apple Computer's (AAPL) daily chart is a study of a stock at a major technical crossroads; will the stock soon bottom and reverse higher, or is this the start of a run back down to the low $400s? |
| Graphic provided by: TradeStation. |
| |
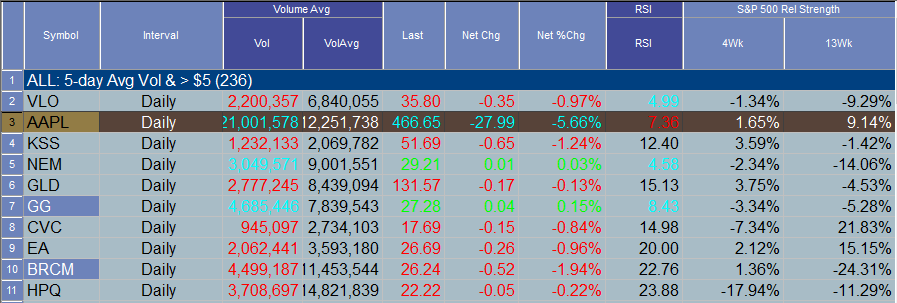
| The summer rally in AAPL got a lot of the bulls nostalgic for the "good old days" of 2009-2012; that's when the stock kept making new highs at a time the company was on a tear, introducing innovative, game-changing products with regularity. The general public started piling in heavily once the stock hit $400 per share, greatly accelerating its final set of runs up to the $700-plus range. The "smart money" was of course selling out their positions during 2012 and were able to avoid much of that previously mentioned 45% plunge. But this recent rally, impressive as the gains were, had poor money flow trend, indicating that the "big boys" were not enthusiastic buyers at all, and that it was lesser-informed retail traders/investors doing the heavy lifting to get the stock back above $500. In doing so, a potentially bullish continuation pattern formed (blue shaded area), one that implied that further price gains were possible; that was all blown to pieces by Wednesday's bearish gap in the stock, with the bullish pattern now all but invalidated. AAPL has now dropped down to the exact convergence point where its 50- and 200-day exponential moving averages (EMAs) meet, and the stock is in a bizarre technical situation: 1. The moving averages will signal a long-term bullish trend if the red 50-day EMA crosses back above the blue 200-day EMA. 2. The 89-day Chaikin Money flow (CMF)(89) histogram shows a bearish money flow trend, one not supportive of a rally anytime soon. 3. AAPL beat analyst expectation for its Q2 earnings, but there have been several earnings misses over the past two years; with Chinese upstart cell phone manufacturers already outselling the iPhone in China, it will be interesting to see just how deeply the company will need to discount its phones in order to maintain its Asian market share. |

|
| Figure 2. AAPL continues to outperform the .SPX in terms of relative strength — for the moment, anyway. Its two-day RSI reading is now below 10.00. |
| Graphic provided by: TradeStation. |
| Graphic provided by: TradeStation Radar Screen. |
| |
| This is truly a "wait and see moment" in AAPL, unless, of course you are still long the stock; in that case, you may wish to buy some put option protection to guard against even greater declines. All others on the sidelines should wait for AAPL to bottom, print a bullish key reversal bar (TradeStation users can easily plot this by selecting this from the "show me" analysis screen). It might be a time to be very cautious with a new AAPL long position, however, as the Nasdaq 100 keeps powering higher — but without AAPL's participation; whether or not AAPL is a "warning shot" regarding an impending major correction is unknown, but something "interesting" is going on here for sure. Be patient and trade wisely until we meet here again. |
Freelance financial markets writer and online publisher of the Trendzetterz.com S&P 500 Weekly Forecast service.
| Title: | Market consultant and writer |
| Company: | Trendzetterz |
| Address: | 81 Hickory Hollow Drive |
| Crossville, TN 38555 | |
| Phone # for sales: | 904-303-4814 |
| Website: | trendzetterz.com |
| E-mail address: | support@trendzetterz.com |
Traders' Resource Links | |
| Trendzetterz has not added any product or service information to TRADERS' RESOURCE. | |
Click here for more information about our publications!
Comments

Request Information From Our Sponsors
- VectorVest, Inc.
- Executive Premier Workshop
- One-Day Options Course
- OptionsPro
- Retirement Income Workshop
- Sure-Fire Trading Systems (VectorVest, Inc.)
- Trading as a Business Workshop
- VectorVest 7 EOD
- VectorVest 7 RealTime/IntraDay
- VectorVest AutoTester
- VectorVest Educational Services
- VectorVest OnLine
- VectorVest Options Analyzer
- VectorVest ProGraphics v6.0
- VectorVest ProTrader 7
- VectorVest RealTime Derby Tool
- VectorVest Simulator
- VectorVest Variator
- VectorVest Watchdog
- StockCharts.com, Inc.
- Candle Patterns
- Candlestick Charting Explained
- Intermarket Technical Analysis
- John Murphy on Chart Analysis
- John Murphy's Chart Pattern Recognition
- John Murphy's Market Message
- MurphyExplainsMarketAnalysis-Intermarket Analysis
- MurphyExplainsMarketAnalysis-Visual Analysis
- StockCharts.com
- Technical Analysis of the Financial Markets
- The Visual Investor
