

HOT TOPICS LIST
- MACD
- Fibonacci
- RSI
- Gann
- ADXR
- Stochastics
- Volume
- Triangles
- Futures
- Cycles
- Volatility
- ZIGZAG
- MESA
- Retracement
- Aroon
INDICATORS LIST
LIST OF TOPICS
PRINT THIS ARTICLE
by Donald W. Pendergast, Jr.
Shares of UGI Corp. appear to be on track to making a major multicycle low in the near future.
Position: N/A
Donald W. Pendergast, Jr.
Freelance financial markets writer and online publisher of the Trendzetterz.com S&P 500 Weekly Forecast service.
PRINT THIS ARTICLE
TRADING SYSTEMS
A Trading Method For The Long Haul
09/11/13 04:27:48 PMby Donald W. Pendergast, Jr.
Shares of UGI Corp. appear to be on track to making a major multicycle low in the near future.
Position: N/A
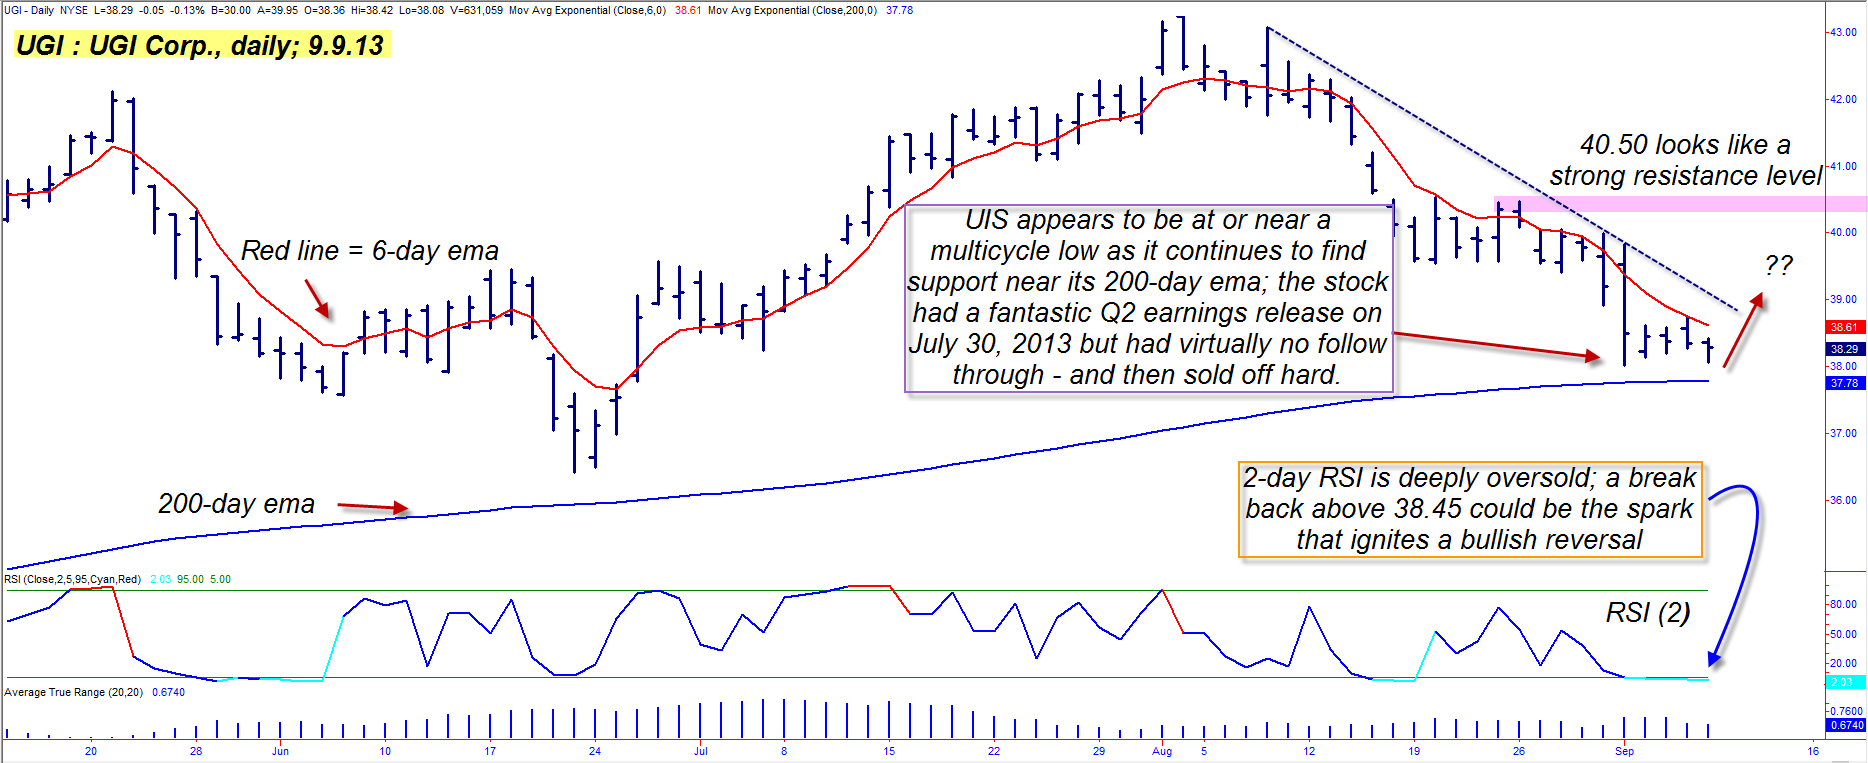
| Sometimes even a "picture-perfect" trade setup fails to deliver profits, and may even result in a loss, but when you see a convergence of daily chart price dynamics like the one you're about to see, the case for a long trade becomes fairly compelling. Here's a closer look at the very interesting and attractive long swing entry setup in UGI (Figure 1). |
|
| Figure 1. UGI Corp. (UGI) shares may be setting up for a bullish reversal; a break back above 38.42 may be the catalyst to bring buyers back into this issue. |
| Graphic provided by: TradeStation. |
| |
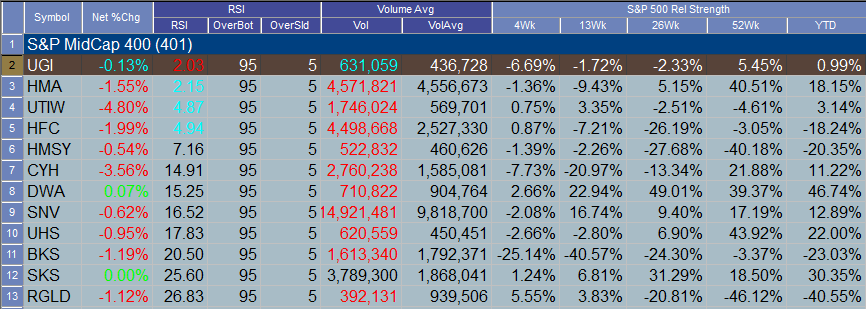
| If you are a new or struggling trader and still need help in sorting out your ideal trading strategy, see if this kind of trading model makes sense to you: 1. You only take long positions when the dominant long-term trend is up — as defined by a 200-period exponential moving average (EMA). 2. You take long positions only when they have completed a proportional pullback/correction against the dominant long-term trend. 3. You only take long positions in stocks that have recently beat their quarterly earnings estimates and/or have a steady trend of earnings growth and positive earnings surprises. Yes, it's a dirt simple model, and you don't need to know a thing about algorithmic trading, neural networks or high level mathematics in order to implement such a strategy — one which can also be used on 60-minute, daily, or weekly charts, depending on how frequently you desire to trade. Here are the basic tools you'll need to scan for potential trade candidates: 1. A scanning/screening feature such as TradeStation's Radar Screen. 2. A list of liquid large and mid-cap stocks (or even small caps, if you love volatility) with an average 50-day trading volume of one million shares. The S&P 500/400 component stocks are perfect for such a strategy. 3. Access to a fundamental screening service like Investor's Business Daily.com, Zacks.com, Midnight Trader.com or similar services that can easily help you filter the earnings winners from the losers. 4. You need some time each evening to do a bit of scanning/screening, earnings research, etc. and some time each morning to enter/exit or adjust your trading positions. If you use TradeStation, for example, you'll want to be looking for stocks with these characteristics: A. Its two-period RSI reading is below 5.00. B. It's trading above its 200-period EMA. C. Average daily volume of one million shares or greater. D. It must have beaten its most recent quarterly earnings estimates and ideally have a strong history of positive earnings surprises over the past eight to 10 quarters. E. The stock's beta should also be greater than 1.00 (meaning that it is more volatile than the S&P 500 index [.SPX]). Most days, you'll have a handful of high-quality stocks that pass all of these screens, so you'll need to do some additional screening: 1. Choose those stocks with the highest four-week comparative relative strength vs. the .SPX. 2. Choose from industry groups that are also far outperforming the .SPX. 3. Diversify across sectors and/or industry groups to avoid over-concentration risk. |
|
| Figure 2. UGI's 2-day RSI reading is at a miniscule 2.03, nearly as low as it can possibly go. |
| Graphic provided by: TradeStation. |
| Graphic provided by: TradeStation Radar Screen. |
| |
| You also need to consider just how many stocks you wish to hold in your portfolio at any given time; in the January 2011 issue of TASC, I wrote an article titled "Making a Good System Great" and shared my research on how adjusting the total number of stocks in a portfolio — and how rapidly that new positions could be added — made a huge difference in the profitability of a basic long pullback trading system. Extensive testing revealed that a four- to six-stock portfolio in which the addition of new positions was limited to a maximum of two per day, produced the best combination of net profits, modest drawdown, and a smooth equity curve. By the way, you've been given all of the essentials needed to build a successful long-only trading system here, but you still need to know what the actual entry trigger is — it's simple, you wait for the two-period RSI to dip below 5.00 and then patiently wait for a bullish reversal bar that will break the previous string of lower highs. That's it, assuming all of the other technical and fundamental factors are in place. In the case of UGI, that means looking for the stock to turn higher, taking out 38.42 once again. Once filled on the trade, place your initial stop beneath the most recent swing low (near 38.00) and then trail everything with a three-bar trailing stop of the daily lows (or hourly lows if using a 60-minute chart, and so forth)until the stock gets back above its six-period EMA. Then hold the position until you get a close back below the six-period EMA; at that point you would go back into cash. |
| This method is difficult (if not impossible) to accurately back test unless you can also include all of the earnings information within the programming, but from visual analysis, it appears to have immensely favorable potential over the long haul, especially for disciplined traders who keep their maximum portfolio risk (portfolio heat) at 4-to 5% maximum. The moving average filter will also help limit the amount of portfolio positions in times of extreme bear markets, yet another big plus for risk-averse traders. Take plenty of time and tweak this basic trading framework until you can personally witness its potential for producing gains over an extended time period; monitor your results in a trading simulator and only begin trading it once you have 100% confidence in this method. Trade wisely until we meet here again. |
Freelance financial markets writer and online publisher of the Trendzetterz.com S&P 500 Weekly Forecast service.
| Title: | Market consultant and writer |
| Company: | Trendzetterz |
| Address: | 81 Hickory Hollow Drive |
| Crossville, TN 38555 | |
| Phone # for sales: | 904-303-4814 |
| Website: | trendzetterz.com |
| E-mail address: | support@trendzetterz.com |
Traders' Resource Links | |
| Trendzetterz has not added any product or service information to TRADERS' RESOURCE. | |
Click here for more information about our publications!
Comments

Request Information From Our Sponsors
- StockCharts.com, Inc.
- Candle Patterns
- Candlestick Charting Explained
- Intermarket Technical Analysis
- John Murphy on Chart Analysis
- John Murphy's Chart Pattern Recognition
- John Murphy's Market Message
- MurphyExplainsMarketAnalysis-Intermarket Analysis
- MurphyExplainsMarketAnalysis-Visual Analysis
- StockCharts.com
- Technical Analysis of the Financial Markets
- The Visual Investor
- VectorVest, Inc.
- Executive Premier Workshop
- One-Day Options Course
- OptionsPro
- Retirement Income Workshop
- Sure-Fire Trading Systems (VectorVest, Inc.)
- Trading as a Business Workshop
- VectorVest 7 EOD
- VectorVest 7 RealTime/IntraDay
- VectorVest AutoTester
- VectorVest Educational Services
- VectorVest OnLine
- VectorVest Options Analyzer
- VectorVest ProGraphics v6.0
- VectorVest ProTrader 7
- VectorVest RealTime Derby Tool
- VectorVest Simulator
- VectorVest Variator
- VectorVest Watchdog