HOT TOPICS LIST
- MACD
- Fibonacci
- RSI
- Gann
- ADXR
- Stochastics
- Volume
- Triangles
- Futures
- Cycles
- Volatility
- ZIGZAG
- MESA
- Retracement
- Aroon
INDICATORS LIST
LIST OF TOPICS
PRINT THIS ARTICLE
by Donald W. Pendergast, Jr.
Shares of Unisys Corp. are once again trading just above a key support level; will a new buy signal soon result?
Position: N/A
Donald W. Pendergast, Jr.
Freelance financial markets writer and online publisher of the Trendzetterz.com S&P 500 Weekly Forecast service.
PRINT THIS ARTICLE
RSI
Unisys Corp. - Swing Buy Setup Forming?
09/10/13 04:08:49 PMby Donald W. Pendergast, Jr.
Shares of Unisys Corp. are once again trading just above a key support level; will a new buy signal soon result?
Position: N/A
| Building a potentially profitable trading system can be a simple, straightforward process. If you understand some basic technical price patterns — ones that have a tendency to repeat again and again — and a good understanding of risk management, position sizing, and portfolio diversification, you may already be well on your way toward a successful stock and ETF trading career. Here are a few ideas to help improve your "pullback against the uptrend" trading regimen. |

|
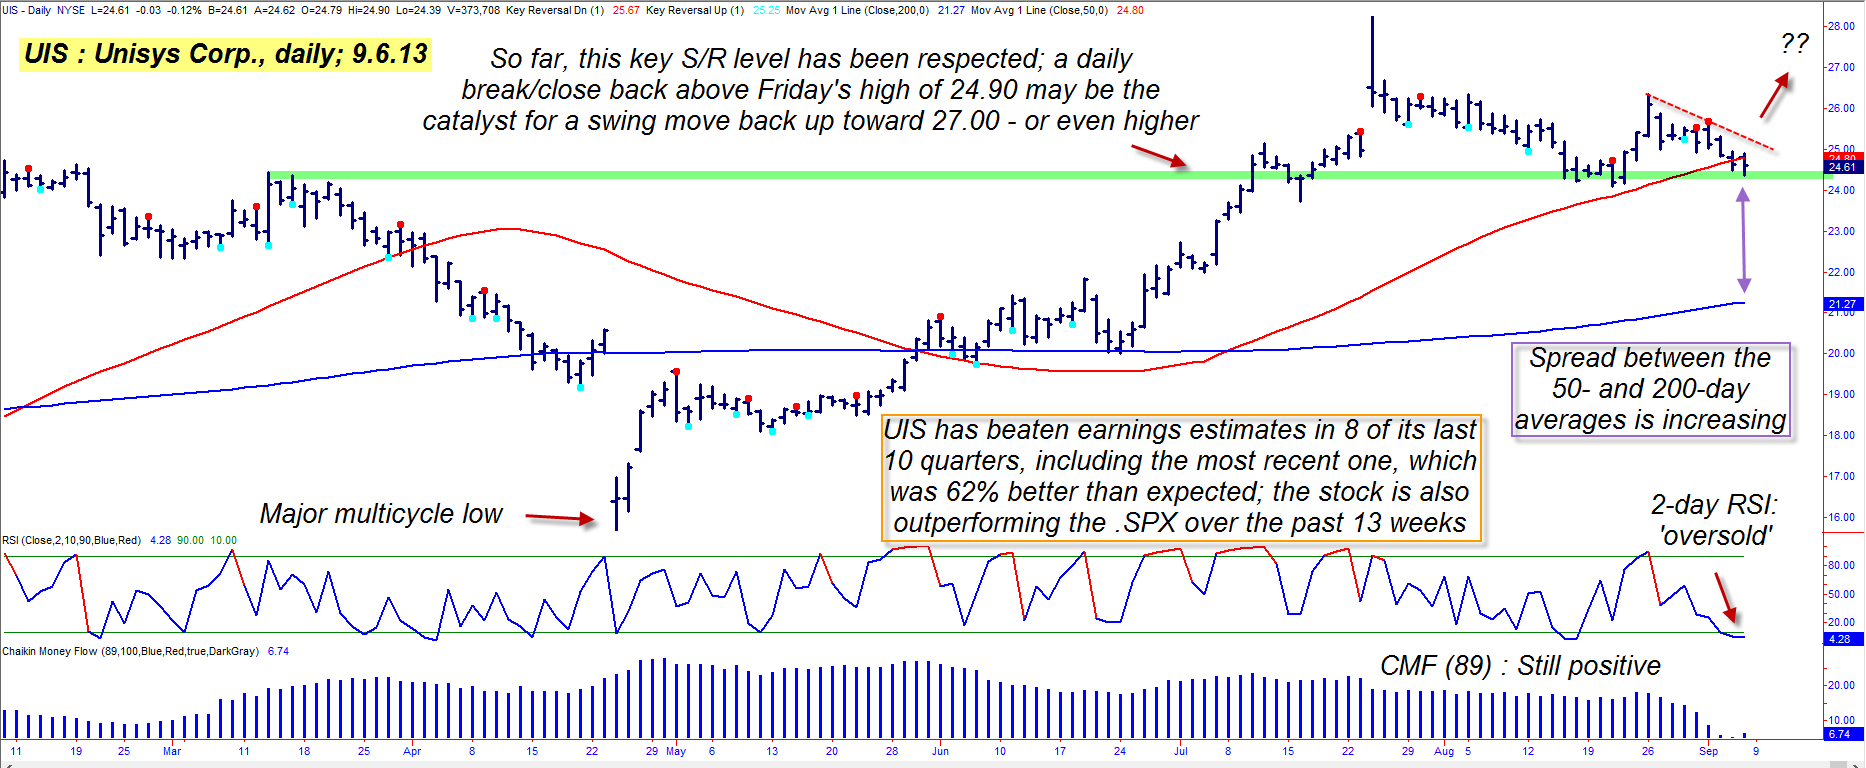
| Figure 1. Technicals and fundamentals may be suggesting that the current pullback in Unisys Corp. (UIS) is offering a potential low-risk buying opportunity. |
| Graphic provided by: TradeStation. |
| |
| Buying pullbacks in a stock or ETF in an established uptrend is definitely a popular trading strategy, one that can work on intraday, daily, and even weekly charts; the strategy works best when you apply a couple of technical and fundamental filters to it, such as: 1. Only buy stocks that are outperforming the S&P 500 index (.SPX) (or any other closely correlated parent stock index of the equity in question). 2. Only buy stocks that have an established trend of meeting and/or beating their quarterly earnings estimates. 3. Only buy stocks that are trading above their 50-day simple moving average (SMA). 4. Only buy stocks that have pulled back toward that moving average. Those four basic trading parameters will actually provide a basic long pullback trade setup template, but you'll still need to include an actual, specific timing mechanism to: A. Identify the pullback. B. Alert you when to actually go long as the stock begins to rebound. As you look at the chart of Unisys Corp. (UIS) in Figure 2 you'll see that a two-day RSI indicator is used to identify the pullback — whenever the RSI drops below five. That's a good indicator for this style of trading, but you can also try using the Money Flow Index (MFI) or Commodity Channel Index (CCI) at various settings to determine which works best for your own trading style. Now that you have an objective, mechanical pullback ID tool, you now need to wait for the pullback to end and for the stock to make a daily close back above the high of the bar that ultimately makes the final low of the pullback. Waiting for the turn to actually occur helps ensure that you: A. Are buying on strength. B. That a high probability pullback low is now in place. Some traders may want to try to "catch a falling knife" in an attempt to try and predict the pullback low in advance or by progressively scaling into a long position as the RSI (CCI, MFI, etc) continues to fall; there are scale trading strategies that work like that, but the danger is that a major bear cycle move is getting underway, causing you to take a devastating loss by the time you finally realize the trade is being dragged relentlessly lower in a major bear market. So, play it safe and let the stock or ETF price action confirm that the pullback low is already in place before attempting to put on a new long trade. |

|
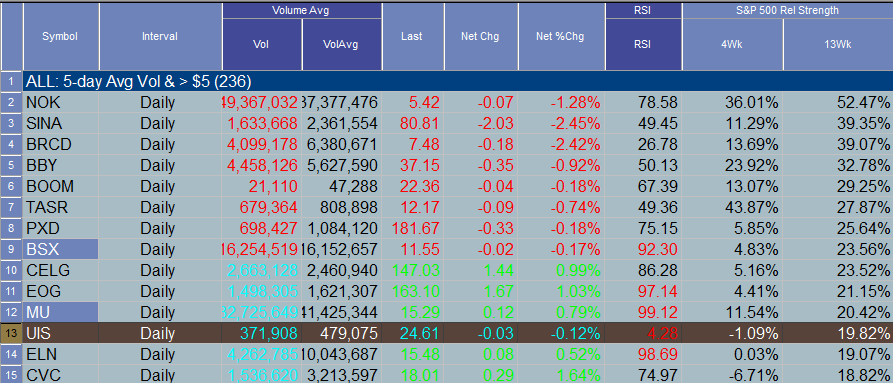
| Figure 2. Shares of Unisys Corp. (UIS) are deeply oversold according to its 2-day RSI indicator. The stock's 13-week comparative relative strength vs. the .SPX indicates a significant out-performance. |
| Graphic provided by: TradeStation. |
| Graphic provided by: TradeStation Radar Screen. |
| |
| So, back to UIS; The stock is sitting just above a strong area of support (green line), it's trading near its 50-day average at a time when the RSI(2) is below 5.00; UIS is also outperforming the .SPX over the past 13 weeks and has a well-established trend of positive earnings reports under its belt, too. Any move back above 24.95 may trigger a new wave of buying, starting a new swing move back up toward the prior swing high of 26.35; once filled on such a move, begin running a two-bar trailing stop of the daily lows; consider taking partial profits if 26.35 is reached, continuing to run the trailing stop until it's finally hit. This is a reversal trade, so try and keep your account risk at 1% or less; as always trade wisely until we meet here again. |
Freelance financial markets writer and online publisher of the Trendzetterz.com S&P 500 Weekly Forecast service.
| Title: | Market consultant and writer |
| Company: | Trendzetterz |
| Address: | 81 Hickory Hollow Drive |
| Crossville, TN 38555 | |
| Phone # for sales: | 904-303-4814 |
| Website: | trendzetterz.com |
| E-mail address: | support@trendzetterz.com |
Traders' Resource Links | |
| Trendzetterz has not added any product or service information to TRADERS' RESOURCE. | |
Click here for more information about our publications!
PRINT THIS ARTICLE

Request Information From Our Sponsors
- VectorVest, Inc.
- Executive Premier Workshop
- One-Day Options Course
- OptionsPro
- Retirement Income Workshop
- Sure-Fire Trading Systems (VectorVest, Inc.)
- Trading as a Business Workshop
- VectorVest 7 EOD
- VectorVest 7 RealTime/IntraDay
- VectorVest AutoTester
- VectorVest Educational Services
- VectorVest OnLine
- VectorVest Options Analyzer
- VectorVest ProGraphics v6.0
- VectorVest ProTrader 7
- VectorVest RealTime Derby Tool
- VectorVest Simulator
- VectorVest Variator
- VectorVest Watchdog
- StockCharts.com, Inc.
- Candle Patterns
- Candlestick Charting Explained
- Intermarket Technical Analysis
- John Murphy on Chart Analysis
- John Murphy's Chart Pattern Recognition
- John Murphy's Market Message
- MurphyExplainsMarketAnalysis-Intermarket Analysis
- MurphyExplainsMarketAnalysis-Visual Analysis
- StockCharts.com
- Technical Analysis of the Financial Markets
- The Visual Investor
