

HOT TOPICS LIST
- MACD
- Fibonacci
- RSI
- Gann
- ADXR
- Stochastics
- Volume
- Triangles
- Futures
- Cycles
- Volatility
- ZIGZAG
- MESA
- Retracement
- Aroon
INDICATORS LIST
LIST OF TOPICS
PRINT THIS ARTICLE
by Billy Williams
The market is putting a lot of downward pressure on stocks but BLOX is breaking away with force.
Position: Buy
Billy Williams
Billy Williams has been trading the markets for 27 years, specializing in momentum trading with stocks and options.
PRINT THIS ARTICLE
TECHNICAL ANALYSIS
Infoblox Surging
09/09/13 04:55:23 PMby Billy Williams
The market is putting a lot of downward pressure on stocks but BLOX is breaking away with force.
Position: Buy
| Infoblox (BLOX) is on the move and its price action and trade volume reveals a stock that has compelling technical criteria that could translate into huge profit potential. The company went public in April 2012 but its price action went on the decline from the moment it started trading on the public markets. It did manage to rally and get close to its previous price high five months later but could never gain the strength to follow through and break higher into an uptrend above its resistance level at $24.15. After September 2012, the bearish price action bled into the rest of the stock's performance for another two months until price found its bottom and exploded higher at the end of November 2012. BLOX's price action was unimpressive to the uninitiated trader not trained to spot forming first base patterns, but for those traders who understand how price action forms these patterns, BLOX was a work in progress. |
|
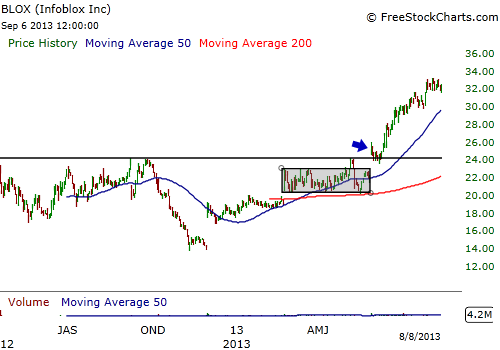
| Figure 1. After the IPO, BLOX's price declined till it found its bottom and began the slow process of building a First Stage Base pattern. A cup & handle pattern formed and you can see the handle portion of the pattern highlighted above. Price tried to rally but lacked the required volume to break above resistance and pulled back, but a few days later managed to breakout and rally. |
| Graphic provided by: www.freestockcharts.com. |
| |
| Most IPO's fail, or are in danger of failing in their price performance within a couple of months of their IPO. Hence, it's wise to sit back and watch how things develop. In the case of BLOX, price declined and then went on to start the slow process of finding its bottom before building a first base pattern so that price could gain a foundation in order to trade higher (Figure 1). Once the base is formed, it's a matter of timing, price, and volume. This is a three-pronged strategy where these three components work together to give you the best entry and the greatest return. At the end of February 2013 to early May, price formed the handle portion of a cup & handle pattern which gave an entry point just over $23 but it failed (Figure 2). While the buy point was triggered, volume failed to deliver enough fuel to push the stock higher and price quickly retreated to the lower level of the handle and would have stopped you out if you had entered. |
|
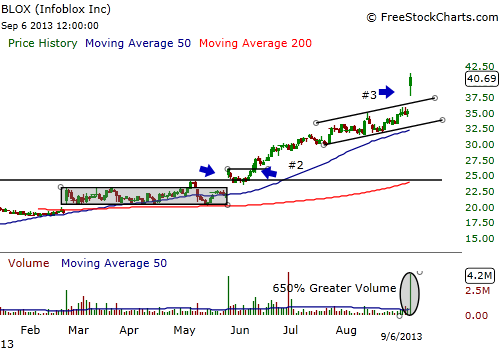
| Figure 2. After the initial breakout, price pulled back and would have stopped you out but at point #2, a second entry developed. Price rallied while forming an ascending trading range but then price broke higher again on huge volume. If you missed the entry, then wait for a pullback on low volume and enter above the previous price high of September 6, 2013. |
| Graphic provided by: www.freestockcharts.com. |
| |
| When price trades through a buy point in a pattern like a cup & handle, accompanying volume must be at least 40% over its 50-day simple moving average (SMA). In this case, volume fell short and the entry point should have been ignored. Later, on May 24, 2013, price gapped up through BLOX's all-time price high, and established resistance level of just over $24 and on almost 800% of BLOX's 50-day SMA volume level. But, price again pulled back and would have potentially stopped you out at a 7% stop-loss level. When volume spikes to such a high level, even at a buy point, it's not uncommon for price to temporarily exhaust itself and pull back. This happens because there is a rush of buyers piling in at the same time and if there aren't any more buyers coming behind them or other buyers are hesitating before committing, then price can temporarily falter. |
| If you're stopped out, don't get scared and abandon the stock because secondary opportunities can present themselves, which is what happened in the case of BLOX. When price pulled back, the second entry opportunity would have been the intraday high of May 24, 2013. A few days later, price traded above the buy point of $25.96 on greater volume where price then entered a solid uptrend and gained more than 25% in less than two months, signaling the eight week rule. The eight week rule states that when a stock gains 25% or more within eight weeks or two months, then you should hang on to the stock with a trailing stop. BLOX formed an upward trading range during its run-up until favorable earnings report and outlook was announced in early September causing price to surge higher on volume of more than 650% of its 50-day SMA. |
| The price gap on September 6, 2013 above the ascending trendline is another entry point that you could have entered or added to your current position. For now, wait for a pullback on lower volume before entering a new position. The 50-day SMA and the 200-day SMA are far apart and price always reverts to the mean which means that price has traded very far and will either pullback or wait for its SMAs to catch up. If a pullback occurs, then enter above the intraday high of September 6, 2013 and use a 7% stop-loss. |
Billy Williams has been trading the markets for 27 years, specializing in momentum trading with stocks and options.
| Company: | StockOptionSystem.com |
| E-mail address: | stockoptionsystem.com@gmail.com |
Traders' Resource Links | |
| StockOptionSystem.com has not added any product or service information to TRADERS' RESOURCE. | |
Click here for more information about our publications!
PRINT THIS ARTICLE

Request Information From Our Sponsors
- VectorVest, Inc.
- Executive Premier Workshop
- One-Day Options Course
- OptionsPro
- Retirement Income Workshop
- Sure-Fire Trading Systems (VectorVest, Inc.)
- Trading as a Business Workshop
- VectorVest 7 EOD
- VectorVest 7 RealTime/IntraDay
- VectorVest AutoTester
- VectorVest Educational Services
- VectorVest OnLine
- VectorVest Options Analyzer
- VectorVest ProGraphics v6.0
- VectorVest ProTrader 7
- VectorVest RealTime Derby Tool
- VectorVest Simulator
- VectorVest Variator
- VectorVest Watchdog
- StockCharts.com, Inc.
- Candle Patterns
- Candlestick Charting Explained
- Intermarket Technical Analysis
- John Murphy on Chart Analysis
- John Murphy's Chart Pattern Recognition
- John Murphy's Market Message
- MurphyExplainsMarketAnalysis-Intermarket Analysis
- MurphyExplainsMarketAnalysis-Visual Analysis
- StockCharts.com
- Technical Analysis of the Financial Markets
- The Visual Investor