

HOT TOPICS LIST
- MACD
- Fibonacci
- RSI
- Gann
- ADXR
- Stochastics
- Volume
- Triangles
- Futures
- Cycles
- Volatility
- ZIGZAG
- MESA
- Retracement
- Aroon
INDICATORS LIST
LIST OF TOPICS
PRINT THIS ARTICLE
by Koos van der Merwe
With the economy expected to recover, is it time to look at dogs?
Position: Sell
Koos van der Merwe
Has been a technical analyst since 1969, and has worked as a futures and options trader with First Financial Futures in Johannesburg, South Africa.
PRINT THIS ARTICLE
ENVELOPES
Vera Bradley
09/09/13 04:48:07 PMby Koos van der Merwe
With the economy expected to recover, is it time to look at dogs?
Position: Sell
| Vera Bradley Designs, Inc. is an American design company best known for its patterned bags. Its products include handbags; totes and specialty bags. The company sells its products under the Vera Bradley brand to approximately 3,400 specialty retailers principally located in the United States, as well as department stores and third party e-commerce sites. As of February 2, 2013, it sold Vera Bradley products through its 65 full-price and 11 outlet stores in the United States; 15 department store locations in Japan; its websites, verabradley.com and verabradley.co.jp; and its annual outlet in Fort Wayne, Indiana. The company was listed on the stock market in October 2010. |
|
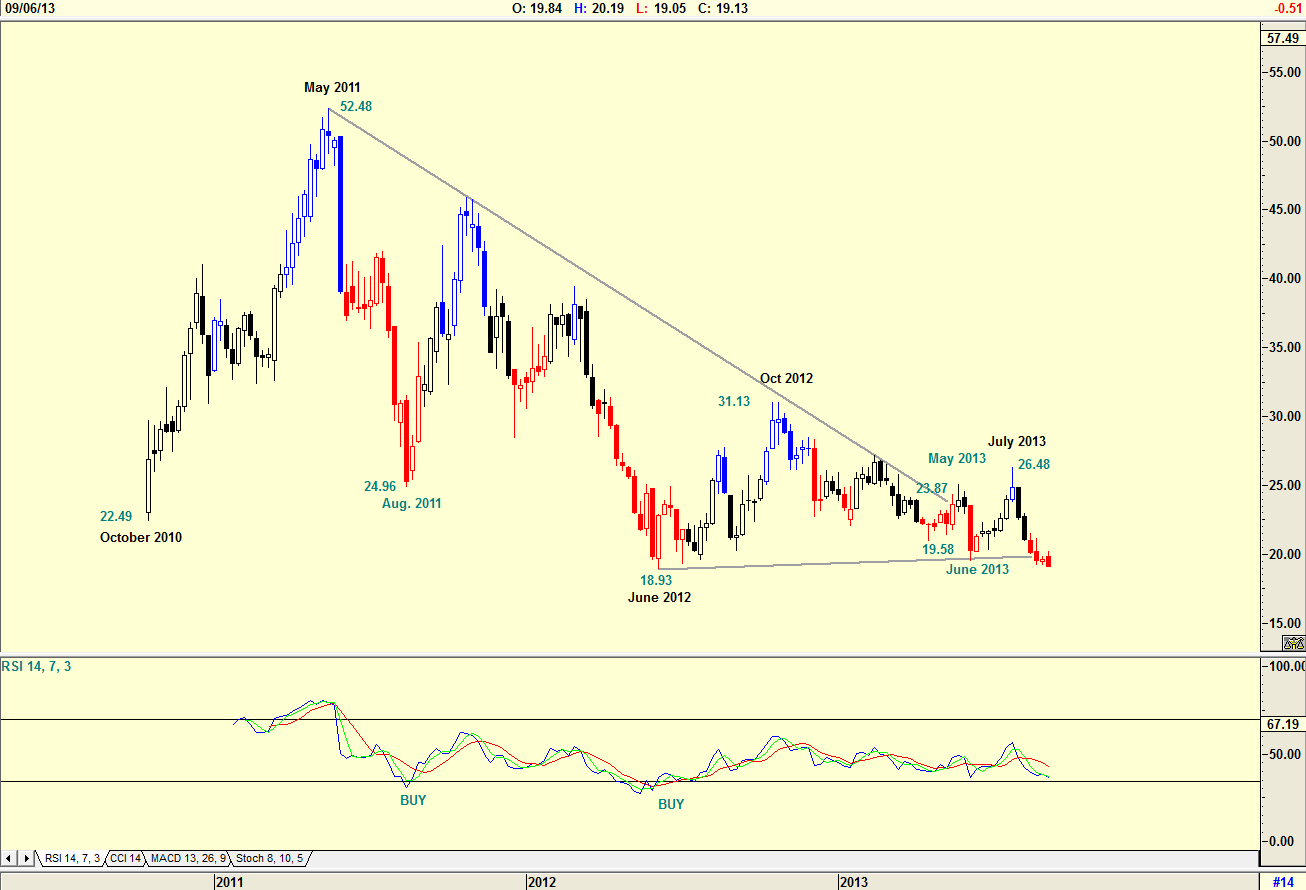
| Figure 1. Weekly chart fro VRA. |
| Graphic provided by: AdvancedGET. |
| |
| The chart in Figure 1 is a weekly chart and shows how the price rose quickly from $22.49 in October 2010 to a high of $52.48 by May 2011. The price then fell from the high to a low of $18.93 by June 2012. The price then rose to $31.13 by October 2012, but then fell to its present price of $19.13. The chart does show that the price broke above its resistance line at $23.87 by May 2013, but promptly fell to $19.58 in June 2013. It then rose to $26.48 by July 2013 and once again fell, breaking the support line to its present price of $19.13. In August 2011 the RSI gave a buy signal, but the indicator did not rise above the 72 line suggesting a sell signal. The RSI indicator gave a buy signal once again in June 2012. The indicator has since been moving sideways and has not moved to overbought levels, suggesting a sell signal. |
|
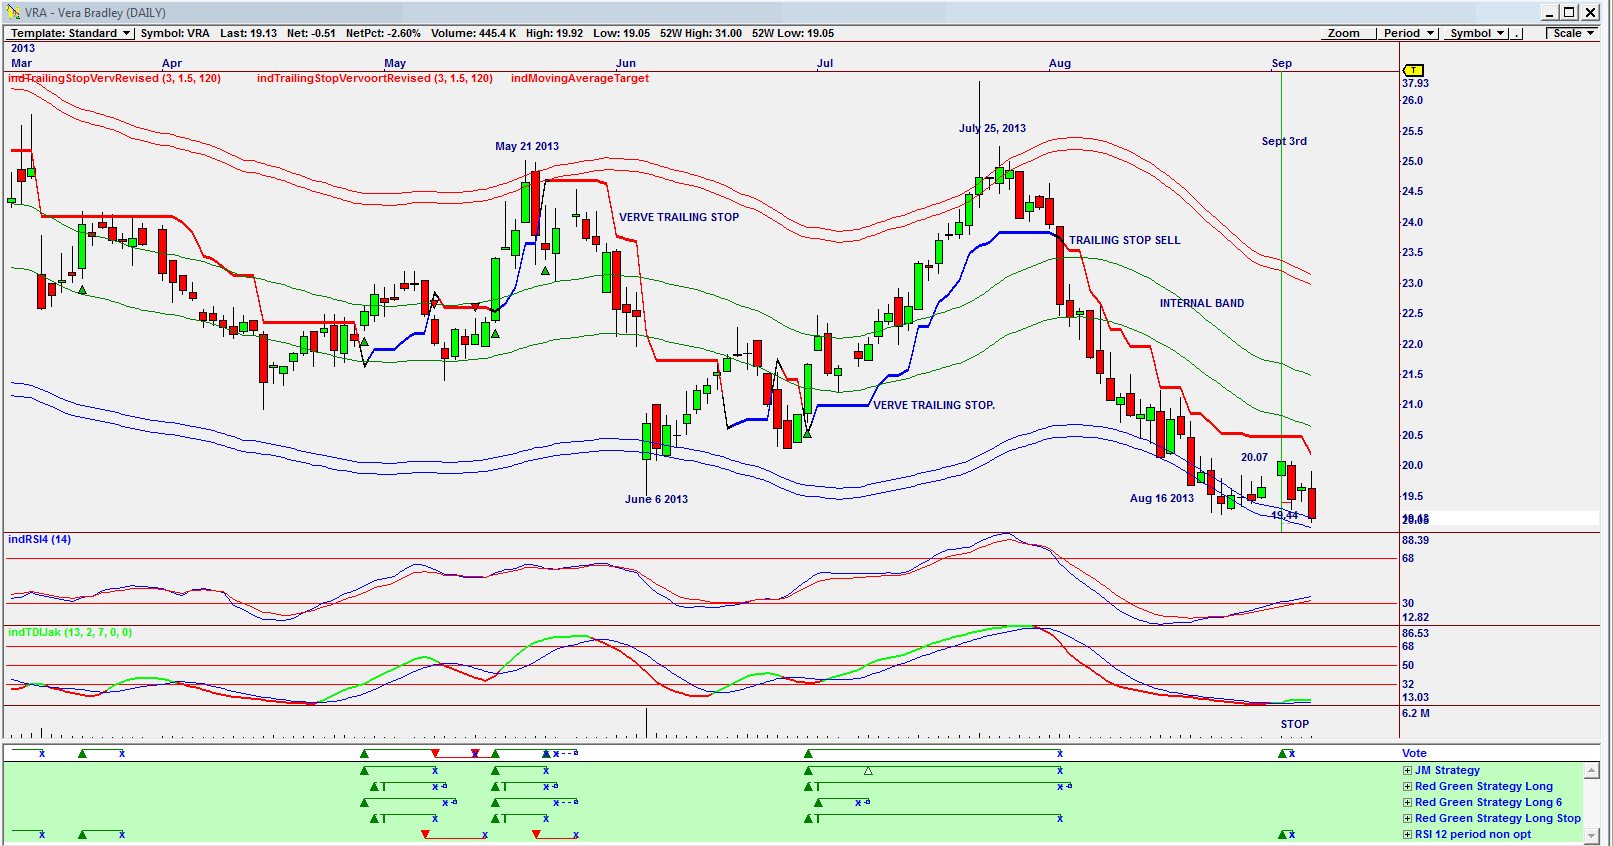
| Figure 2. Daily chart for VRA showing external and internal bands. |
| Graphic provided by: Omnitrader. |
| |
| The chart in Figure 2 is a daily chart showing buy and sell signals on the vote line. On September 3, 2013 the price gave a buy signal when the price was $20.07. However, the next day the price promptly gave a sell stop signal when the price fell sharply to $19.44, a buy and sell signal based on the RSI 12-period non opt strategy shown in green below the vote line. Looking at the chart, you can see how the share price fell on May 21, 2013 after testing the upper external band. The price then fell to the lower external band by June 6, 2013 and promptly rose to test the upper band on July 25, 2013. The price then fell and tested the lower band in August 16, 2013 but continued to fall rather than rise as it had previously. After four days the price did rise to $20.07 but promptly fell to $19.44 to retest the lower band. I would not be a buyer of Vera Bradley at the moment even though the RSI is trending upward, and the TDI indicator has given a buy signal. However, this is a share I shall place on my watch list, and look for a buy signal in the near future. One strong negative is that on September 6, 2013 Jim Cramer in his program, Mad Money, suggested that you should look at Vera Bradley shares because the share price is at a 52-week low and is likely to go lower, "Vera Bradley is a stock I don't want to date." |
Has been a technical analyst since 1969, and has worked as a futures and options trader with First Financial Futures in Johannesburg, South Africa.
| Address: | 3256 West 24th Ave |
| Vancouver, BC | |
| Phone # for sales: | 6042634214 |
| E-mail address: | petroosp@gmail.com |
Click here for more information about our publications!
PRINT THIS ARTICLE

Request Information From Our Sponsors
- StockCharts.com, Inc.
- Candle Patterns
- Candlestick Charting Explained
- Intermarket Technical Analysis
- John Murphy on Chart Analysis
- John Murphy's Chart Pattern Recognition
- John Murphy's Market Message
- MurphyExplainsMarketAnalysis-Intermarket Analysis
- MurphyExplainsMarketAnalysis-Visual Analysis
- StockCharts.com
- Technical Analysis of the Financial Markets
- The Visual Investor
- VectorVest, Inc.
- Executive Premier Workshop
- One-Day Options Course
- OptionsPro
- Retirement Income Workshop
- Sure-Fire Trading Systems (VectorVest, Inc.)
- Trading as a Business Workshop
- VectorVest 7 EOD
- VectorVest 7 RealTime/IntraDay
- VectorVest AutoTester
- VectorVest Educational Services
- VectorVest OnLine
- VectorVest Options Analyzer
- VectorVest ProGraphics v6.0
- VectorVest ProTrader 7
- VectorVest RealTime Derby Tool
- VectorVest Simulator
- VectorVest Variator
- VectorVest Watchdog