HOT TOPICS LIST
- MACD
- Fibonacci
- RSI
- Gann
- ADXR
- Stochastics
- Volume
- Triangles
- Futures
- Cycles
- Volatility
- ZIGZAG
- MESA
- Retracement
- Aroon
INDICATORS LIST
LIST OF TOPICS
PRINT THIS ARTICLE
by Koos van der Merwe
With all the uncertainty in the world, should you sit on cash or look for stocks to buy?
Position: Accumulate
Koos van der Merwe
Has been a technical analyst since 1969, and has worked as a futures and options trader with First Financial Futures in Johannesburg, South Africa.
PRINT THIS ARTICLE
ELLIOTT WAVE
Is Ebay A Stock To Watch?
09/06/13 03:58:13 PMby Koos van der Merwe
With all the uncertainty in the world, should you sit on cash or look for stocks to buy?
Position: Accumulate
| There is so much uncertainty — we have events in the Middle East unfolding and creating uncertainty, with a new Fed chief in the wings, with the Republican party talking of a government shutdown as Congress looks at debt limits, and concerns about housing if mortgage rates go above 5%. To add to that, it is September, which is historically a rough month in the market. Is it time to look for bargains in the market, or stay in cash? Technical analysis has always suggested that you should only buy on the way up, not try to catch a falling knife. However, researching what to buy as the market recovers, should always be a priority. One share that caught my attention is eBay. |

|
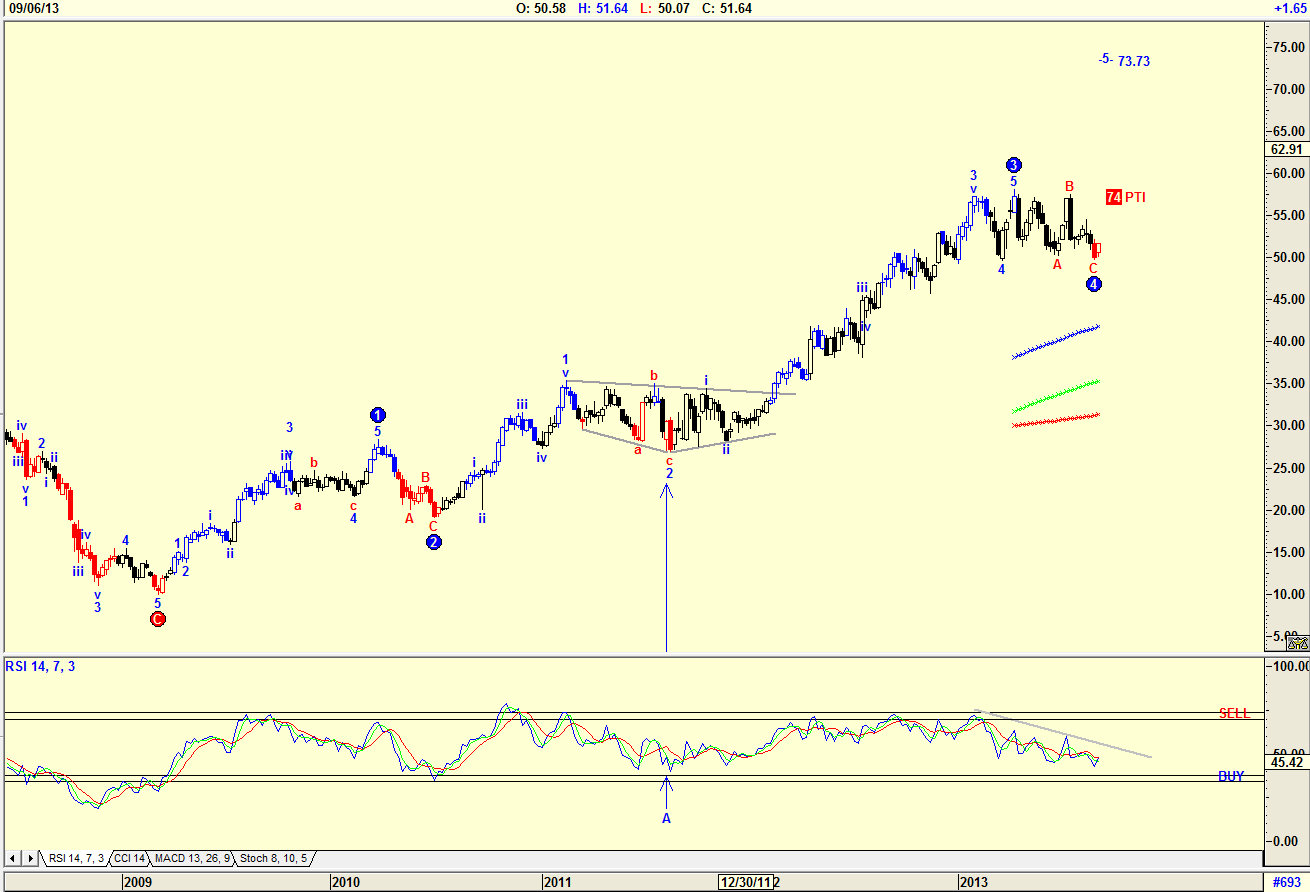
| Figure 1. Weekly chart of E-Bay with Elliott wave count. |
| Graphic provided by: AdvancedGET. |
| |
| The chart in Figure 1 is a weekly Elliott wave count of eBay. The Advanced GET Elliott wave count is suggesting that the share is completing a WAVE 4 with a WAVE 5 target of $73.73. The PTI (probability index) is 74%, a very strong rating. The RSI indicator is still suggesting further downside. However, looking back over RSI history, you can see how, at 'A' on the index, the share price started moving up after a strong consolidation period without the RSI reaching buy levels. |

|
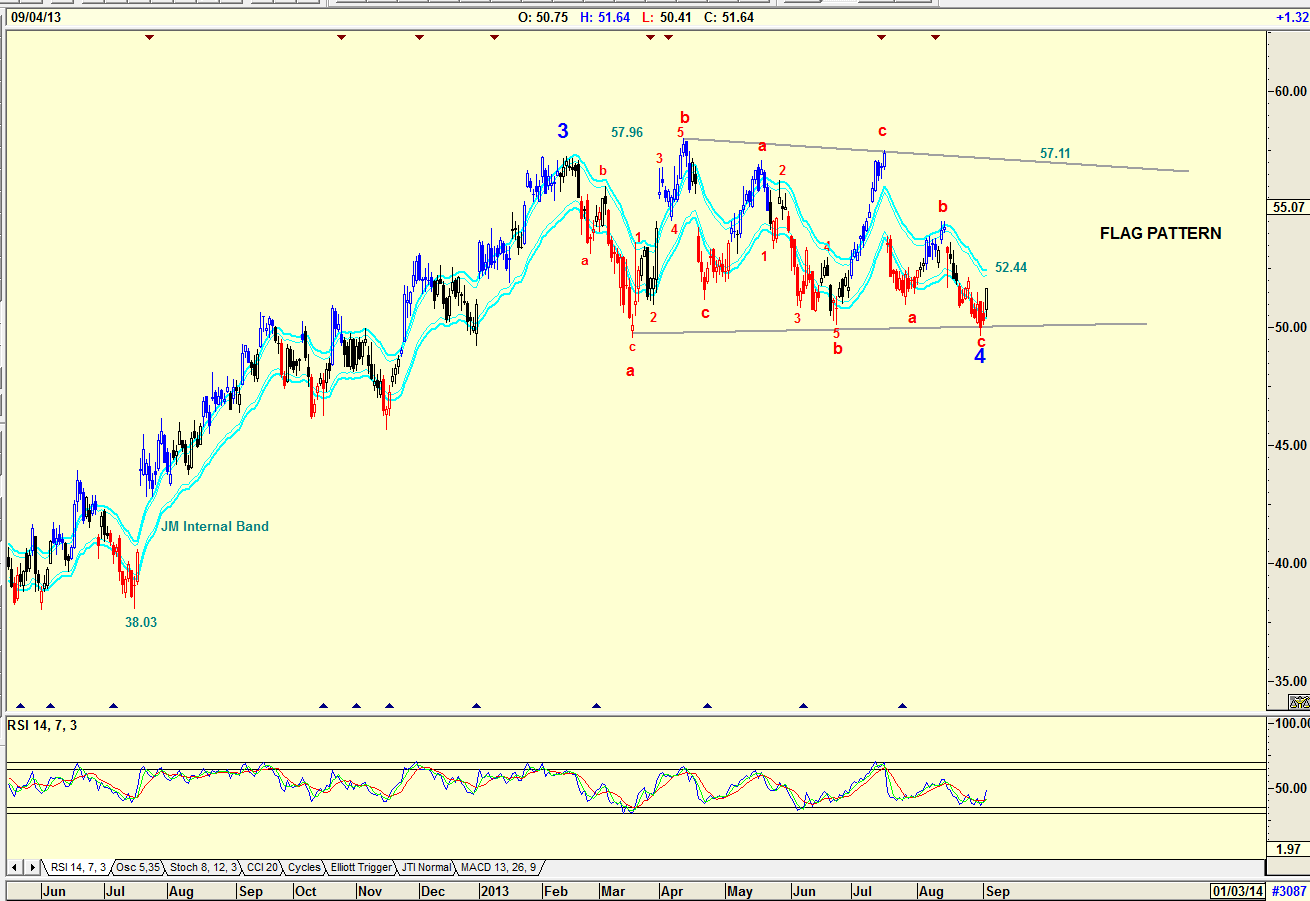
| Figure 2. Daily chart of E-Bay showing flag pattern. |
| Graphic provided by: AdvancedGET. |
| |
| The chart in Figure 2 is a daily chart, showing the flag pattern that has formed. The pattern is suggesting that a buy signal will only be given should the price break above the upper resistance line at $57.11. The target suggested by the pattern is $77.89 (57.96-38.03=19.93+57.96 = 77.89), not shown on the chart. However, investors could consider buying the share when the price breaks above the upper JM Internal Band line at $52.44. |

|
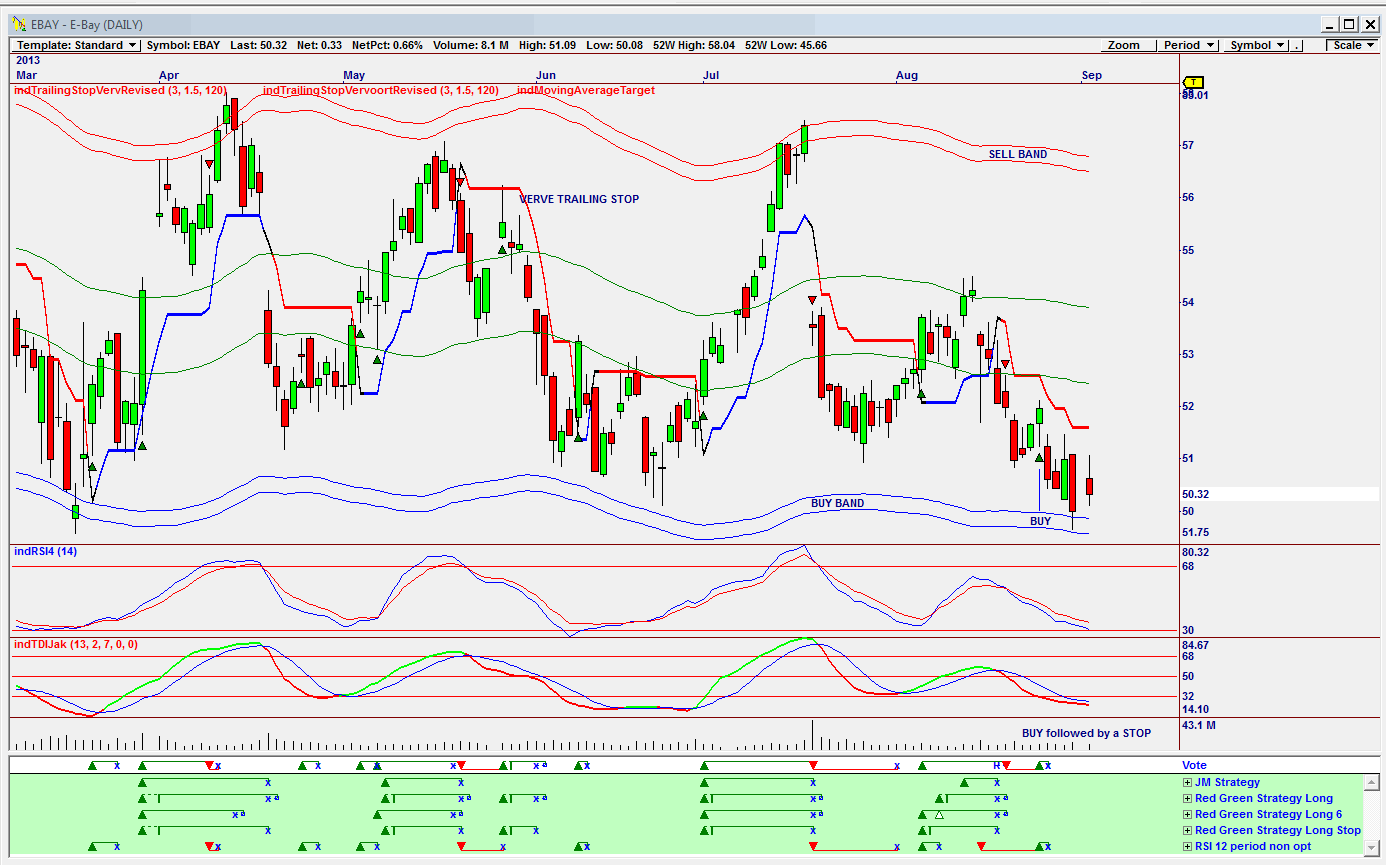
| Figure 3 Omnitrader chart with internal and external band showing BUY/SELL zones. |
| Graphic provided by: Omnitrader. |
| |
| The chart in Figure 3 is an Omnitrader chart showing the buy/sell bands. When a buy signal is given on the vote line, and the price is flirting with the lower buy band, a very strong buy signal is given. The buy signal given on the vote line is a summation of the strategies shown in green below the vote line. A sell signal is given as the price approaches the upper band and confirmed when the price breaks below the verve trailing stop. The formula for the band is an Omnitrader internal formula, and has proved exceptionally helpful in making buy/sell decisions. I would not be a buyer of EBAY at the moment even though it is extremely tempting, simply because of the uncertainty existing in the world today, but the share is definitely on my watch list for a buy as and if the uncertainty resolves itself. |
Has been a technical analyst since 1969, and has worked as a futures and options trader with First Financial Futures in Johannesburg, South Africa.
| Address: | 3256 West 24th Ave |
| Vancouver, BC | |
| Phone # for sales: | 6042634214 |
| E-mail address: | petroosp@gmail.com |
Click here for more information about our publications!
Comments

Request Information From Our Sponsors
- VectorVest, Inc.
- Executive Premier Workshop
- One-Day Options Course
- OptionsPro
- Retirement Income Workshop
- Sure-Fire Trading Systems (VectorVest, Inc.)
- Trading as a Business Workshop
- VectorVest 7 EOD
- VectorVest 7 RealTime/IntraDay
- VectorVest AutoTester
- VectorVest Educational Services
- VectorVest OnLine
- VectorVest Options Analyzer
- VectorVest ProGraphics v6.0
- VectorVest ProTrader 7
- VectorVest RealTime Derby Tool
- VectorVest Simulator
- VectorVest Variator
- VectorVest Watchdog
- StockCharts.com, Inc.
- Candle Patterns
- Candlestick Charting Explained
- Intermarket Technical Analysis
- John Murphy on Chart Analysis
- John Murphy's Chart Pattern Recognition
- John Murphy's Market Message
- MurphyExplainsMarketAnalysis-Intermarket Analysis
- MurphyExplainsMarketAnalysis-Visual Analysis
- StockCharts.com
- Technical Analysis of the Financial Markets
- The Visual Investor
