

HOT TOPICS LIST
- MACD
- Fibonacci
- RSI
- Gann
- ADXR
- Stochastics
- Volume
- Triangles
- Futures
- Cycles
- Volatility
- ZIGZAG
- MESA
- Retracement
- Aroon
INDICATORS LIST
LIST OF TOPICS
PRINT THIS ARTICLE
by Donald W. Pendergast, Jr.
Facebook shares continue to remain strong, shrugging off the recent weakness in the broad markets with ease. Is a correction overdue or does this stock still have more ground to gain?
Position: N/A
Donald W. Pendergast, Jr.
Freelance financial markets writer and online publisher of the Trendzetterz.com S&P 500 Weekly Forecast service.
PRINT THIS ARTICLE
KELTNER CHANNELS
Facebook: A Pause Before A New Multi-Month High?
09/05/13 04:48:37 PMby Donald W. Pendergast, Jr.
Facebook shares continue to remain strong, shrugging off the recent weakness in the broad markets with ease. Is a correction overdue or does this stock still have more ground to gain?
Position: N/A
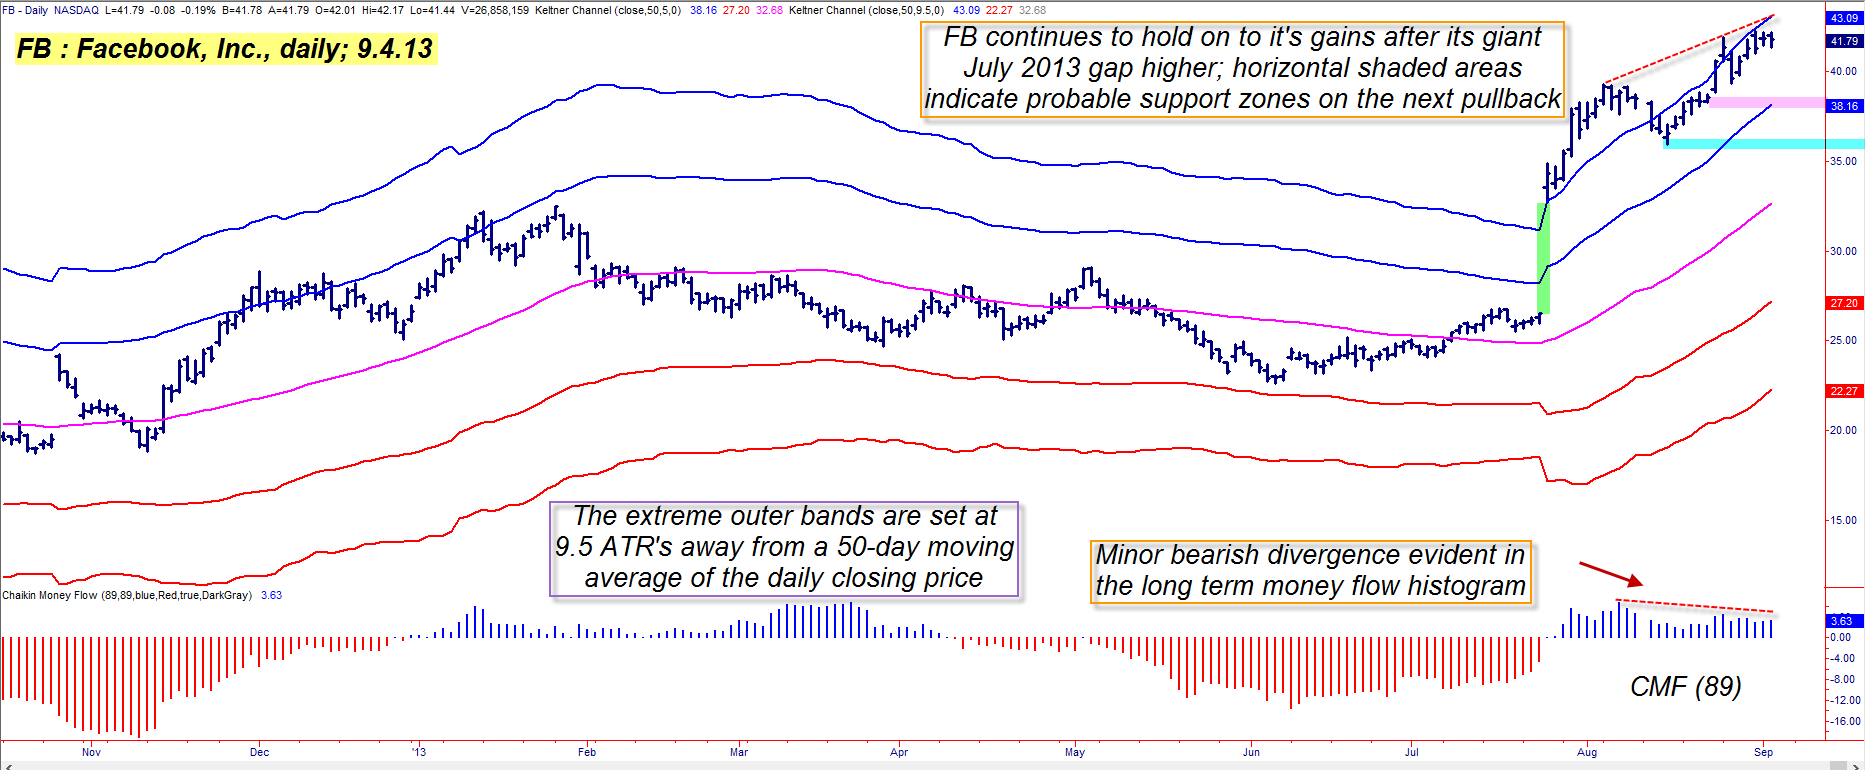
| Many market technicians seem to believe that all available data — even insider trading knowledge — is fully reflected in the technical chart of a given stock, and to a large extent, they are right — but not always. One look at the daily chart of Facebook, Inc. (FB) in Figure 1 makes it clear that no one really knew just how great FB's Q2 earnings would be (except for insiders who had prepositioned themselves for profit, of course), otherwise there wouldn't have been that much of a gap higher after the news was released. Also of note is that the gap hasn't gotten anywhere near close to being filled (and for all we know, may never be), with buyers continuing to drive FB back up toward its May 2012 IPO valuation of 45.00. So, the next time someone tells you that a stock chart reflects the "true" or "fair" value of a stock, think twice. Earning trends are the primary force that drive stocks higher or lower, and if you can keep abreast of such trends, you can have a powerful trading edge working for you that just isn't found on a purely technical price chart. With that said, let's look at FB's daily chart to see what's going on. |
|
| Figure 1. Most stocks spend very little time trading above/below the outer Keltner Bands. FB's recent price strength is based mostly on the blowout Q2 earnings report of July 25th 2013 and stock's subsequent bullish price gap. |
| Graphic provided by: TradeStation. |
| |
| To simplify the chart dynamics in basic terms, what we see here is an "irresistible force" meeting an "immoveable object" sort of image. The irresistible force, so to speak, is the incredible bullish up thrust coming in the wake of the July 2013 price gap, while the immoveable object would appear to be the statistically important resistance zone of the upper Keltner Band (set at 9.5 ATRs away from a 50-day moving average). As in the case of Bollinger Bands, Keltner Bands can be used in several ways: 1. To identify support/resistance levels. 2. To confirm price breakouts. 3. To confirm trend reversals at significant tops/bottoms. In FB's case, we've already seen it blast through a key resistance on the big July 25, 2013 bullish gap, and we've also witnessed it pull back slightly before rising again in lockstep with the upper band. Normally, after the first big push above the top band, there is a pullback followed by another rally attempt; if the second rally attempt peaks out beneath the upper band, then you have advance warning that a correction is imminent. For most of the past three weeks, FB has made daily closes beneath the band, even as both have continued to trend higher; this will resolve itself sooner rather than later, with the most likely outcome being a correction. The correction may be of the proportional "pullback within an uptrend" variety rather than a full-blown bearish trend reversal. With favorable earnings growth projections, an ever expanding user base, and positive long-term money flow in place, any such correction should be looked at as a potentially low-risk buying opportunity in FB. |
|
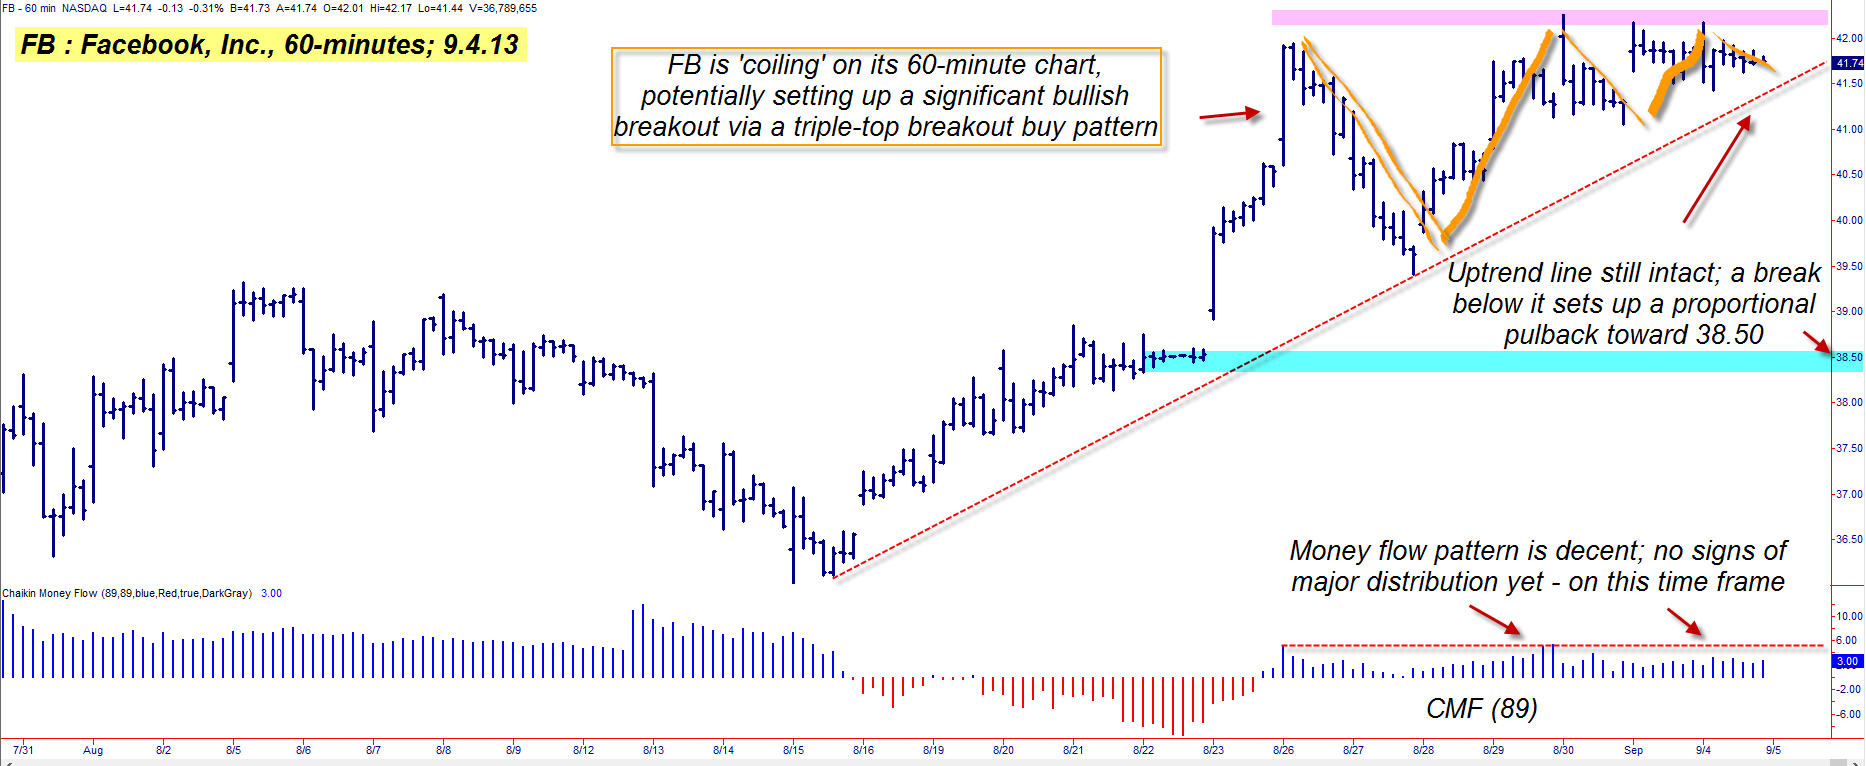
| Figure 2. On the 60-minute time frame, note the formation of a potential triple top buy pattern; a strong break out of the pattern could actually propel FB back above its extreme upper Keltner Band once again. |
| Graphic provided by: TradeStation. |
| |
| Now, there's an added dimension to all of these dynamics; if we drop down to the 60-minute time frame (Figure 2), we find that FB appears to be setting up for a possible triple-top breakout buy pattern; money flow is decent, the chart pattern is clear and the trend is still higher. What may be going on is that FB is indeed setting up for another push higher — possibly above the top Keltner band — before running out of steam and pulling back below 40.00. If you're currently long FB, make sure you have a trailing stop and/or some put option protection in place, and if you're not long FB, be patient and wait for the next pullback to daily chart support, as it could be one of the lowest-risk long entries available given the stock's healthy earnings growth trend. Trade wisely until we meet here again. |
Freelance financial markets writer and online publisher of the Trendzetterz.com S&P 500 Weekly Forecast service.
| Title: | Market consultant and writer |
| Company: | Trendzetterz |
| Address: | 81 Hickory Hollow Drive |
| Crossville, TN 38555 | |
| Phone # for sales: | 904-303-4814 |
| Website: | trendzetterz.com |
| E-mail address: | support@trendzetterz.com |
Traders' Resource Links | |
| Trendzetterz has not added any product or service information to TRADERS' RESOURCE. | |
Click here for more information about our publications!
Comments

Request Information From Our Sponsors
- StockCharts.com, Inc.
- Candle Patterns
- Candlestick Charting Explained
- Intermarket Technical Analysis
- John Murphy on Chart Analysis
- John Murphy's Chart Pattern Recognition
- John Murphy's Market Message
- MurphyExplainsMarketAnalysis-Intermarket Analysis
- MurphyExplainsMarketAnalysis-Visual Analysis
- StockCharts.com
- Technical Analysis of the Financial Markets
- The Visual Investor
- VectorVest, Inc.
- Executive Premier Workshop
- One-Day Options Course
- OptionsPro
- Retirement Income Workshop
- Sure-Fire Trading Systems (VectorVest, Inc.)
- Trading as a Business Workshop
- VectorVest 7 EOD
- VectorVest 7 RealTime/IntraDay
- VectorVest AutoTester
- VectorVest Educational Services
- VectorVest OnLine
- VectorVest Options Analyzer
- VectorVest ProGraphics v6.0
- VectorVest ProTrader 7
- VectorVest RealTime Derby Tool
- VectorVest Simulator
- VectorVest Variator
- VectorVest Watchdog