

HOT TOPICS LIST
- MACD
- Fibonacci
- RSI
- Gann
- ADXR
- Stochastics
- Volume
- Triangles
- Futures
- Cycles
- Volatility
- ZIGZAG
- MESA
- Retracement
- Aroon
INDICATORS LIST
LIST OF TOPICS
PRINT THIS ARTICLE
by Chaitali Mohile
The candlestick pattern, whether based on one bar or as a group of bars, provides technical insight into a specific stock, index, or exchange traded fund (ETF).
Position: N/A
Chaitali Mohile
Active trader in the Indian stock markets since 2003 and a full-time writer. Trading is largely based upon technical analysis.
PRINT THIS ARTICLE
CANDLESTICK CHARTING
EBF Shows Strength Of Candlestick Formations
09/04/13 03:40:02 PMby Chaitali Mohile
The candlestick pattern, whether based on one bar or as a group of bars, provides technical insight into a specific stock, index, or exchange traded fund (ETF).
Position: N/A
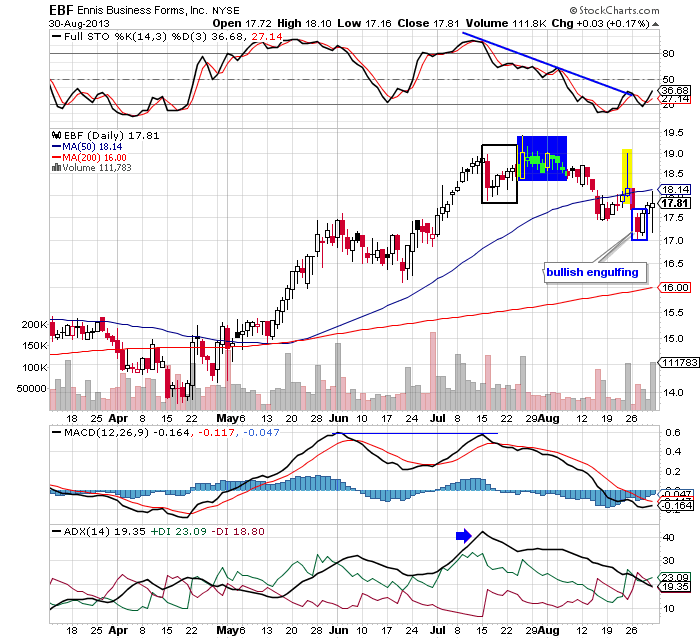
| Every candlestick formed on the price chart represents price movement. Each formation plays an important role in explaining the current, as well as future action, path for a stock or index. Here I have taken the chart of Ennis Business Form (EBF) as an example to show a few commonly occurring candlestick formations along with three easily understood indicators. On the daily chart in Figure 1, EBF made a small profit of $4 after a bullish moving average breakout in May 2013. The stock dropped from the top, forming a bearish (red) candlestick with upper and lower shadows. These shadows developed an intermediate support-resistance level for the stock. |
| The black hollow box and the blue box in Figure 1 moved between the upper and lower range formed by the candlestick shadows. In the earlier black box, although EBF formed a morning candlestick pattern — a bullish reversal candlestick formation — it failed to breach its intermediate resistance. The cluster of doji candlesticks that were formed immediately after, showed uncertainty and the upcoming volatility in the rally. The bullish strength diminished as the stock violated the support formed by the lower shadow as well as the 50-day moving average (MA). |
|
| FIGURE 1: EBF, DAILY. |
| Graphic provided by: StockCharts.com. |
| |
| A shooting star candlestick pattern formed under the newly formed 50-day MA resistance confirmed the bearish movement of EBF. This fresh bearish signal suspended the upward price action initiated by a bullish engulfing pattern formed below 50-day MA. For additional confirmation we can use various indicators along with the candlestick formations. When the candlesticks in the black and blue box were being constructed, the moving average convergence/divergence (MACD)(12,6,9) formed a double top — a bearish reversal pattern in Figure 1. An uptrend indicated by the average directional index (ADX)(14) was overheated, and the stochastic oscillator highlighted negative divergence. Thus, the upcoming bearish force suggested by the various candlesticks in Figure 1 was confirmed by the three indicators. |
|
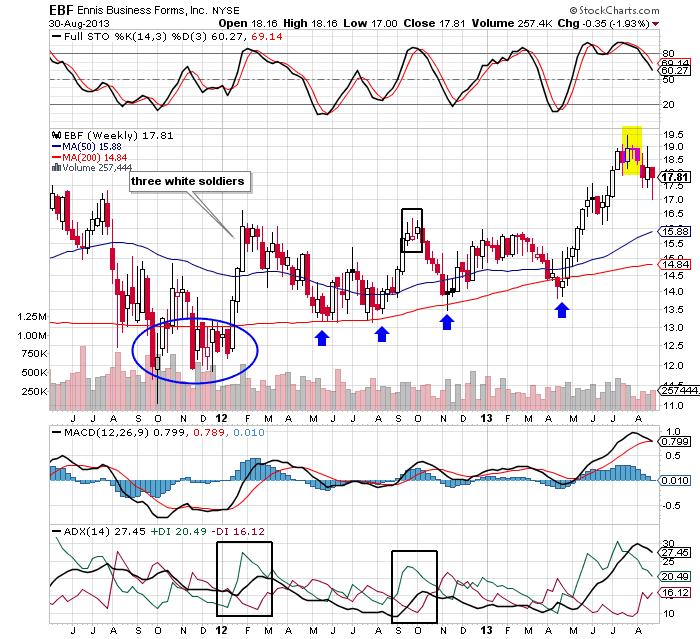
| FIGURE 2: EBF, WEEKLY. |
| Graphic provided by: StockCharts.com. |
| |
| A bullish rally on the weekly time frame chart in Figure 2 was initiated by the three white soldiers. The three white large candlesticks formed with the support of the 200-day moving average (MA) closed at the new highs. Each candlestick opened near or above the previous high and ended up at the new high. This journey is considered to be highly bullish. Thereafter, the long-term moving average extended robust support to all the volatile rallies of EBF in Figure 2. The blue arrows are marked to show the support as well as the lower shadows of the candlesticks. The black box in Figure 2 shows the cluster of doji candlesticks that pulled down the stock toward the MA support line. There are a large number of bearish and doji candlesticks on the price chart, suggesting high volatility and instability in the stock. In mid-April 2013, EBF formed a hammer single candlestick pattern to begin an upward rally. The hammer candlestick reversed the downtrend and began a fresh uptrend in Figure 2. |
| An evening star candlestick pattern formed at the 19.5 level terminated the upward rally. This bearish reversal candlestick pattern was confirmed by the double top formed by the stochastic oscillator. The reversing MACD(12,26,9)and ADX(14) strengthened the candlestick formation. After descending from the top, EBF formed a hanging man single candlestick pattern near the 18 level. Hence the stock would retrace towards its moving average support. To conclude, the candlestick formation shows the strength in the rallies and helps to plan the future road map of stocks, indexes, and ETFs. |
Active trader in the Indian stock markets since 2003 and a full-time writer. Trading is largely based upon technical analysis.
| Company: | Independent |
| Address: | C1/3 Parth Indraprasth Towers. Vastrapur |
| Ahmedabad, Guj 380015 | |
| E-mail address: | chaitalimohile@yahoo.co.in |
Traders' Resource Links | |
| Independent has not added any product or service information to TRADERS' RESOURCE. | |
Click here for more information about our publications!
PRINT THIS ARTICLE

Request Information From Our Sponsors
- StockCharts.com, Inc.
- Candle Patterns
- Candlestick Charting Explained
- Intermarket Technical Analysis
- John Murphy on Chart Analysis
- John Murphy's Chart Pattern Recognition
- John Murphy's Market Message
- MurphyExplainsMarketAnalysis-Intermarket Analysis
- MurphyExplainsMarketAnalysis-Visual Analysis
- StockCharts.com
- Technical Analysis of the Financial Markets
- The Visual Investor
- VectorVest, Inc.
- Executive Premier Workshop
- One-Day Options Course
- OptionsPro
- Retirement Income Workshop
- Sure-Fire Trading Systems (VectorVest, Inc.)
- Trading as a Business Workshop
- VectorVest 7 EOD
- VectorVest 7 RealTime/IntraDay
- VectorVest AutoTester
- VectorVest Educational Services
- VectorVest OnLine
- VectorVest Options Analyzer
- VectorVest ProGraphics v6.0
- VectorVest ProTrader 7
- VectorVest RealTime Derby Tool
- VectorVest Simulator
- VectorVest Variator
- VectorVest Watchdog