HOT TOPICS LIST
- MACD
- Fibonacci
- RSI
- Gann
- ADXR
- Stochastics
- Volume
- Triangles
- Futures
- Cycles
- Volatility
- ZIGZAG
- MESA
- Retracement
- Aroon
INDICATORS LIST
LIST OF TOPICS
PRINT THIS ARTICLE
by Koos van der Merwe
Are you looking for a good company that pays a pleasant dividend? Here are some.
Position: Buy
Koos van der Merwe
Has been a technical analyst since 1969, and has worked as a futures and options trader with First Financial Futures in Johannesburg, South Africa.
PRINT THIS ARTICLE
DIVIDEND YIELD
Three Canadian Dividend Stocks
09/04/13 03:46:15 PMby Koos van der Merwe
Are you looking for a good company that pays a pleasant dividend? Here are some.
Position: Buy
| The three funds listed below were created to provide investors with exposure on a tax-advantaged basis: Top 20 Dividend Trust (TTY.UN-T) – exposure to an equally weighted portfolio of the 20 highest yielding equity securities included in the S&P/TSX 60 index. Top 20 Europe Dividend Trust (TTE.UN-T) – to an equally-weighted portfolio comprised of the 20 highest yielding equity securities included in The Europe Dow, a regional index of the Dow Jones Industrial Average. Top 20 U.S. Dividend Trust (TUT.UN-T) – to an equally-weighted portfolio comprised of the 20 highest yielding equity securities included in the Dow Jones Industrial Average. |

|
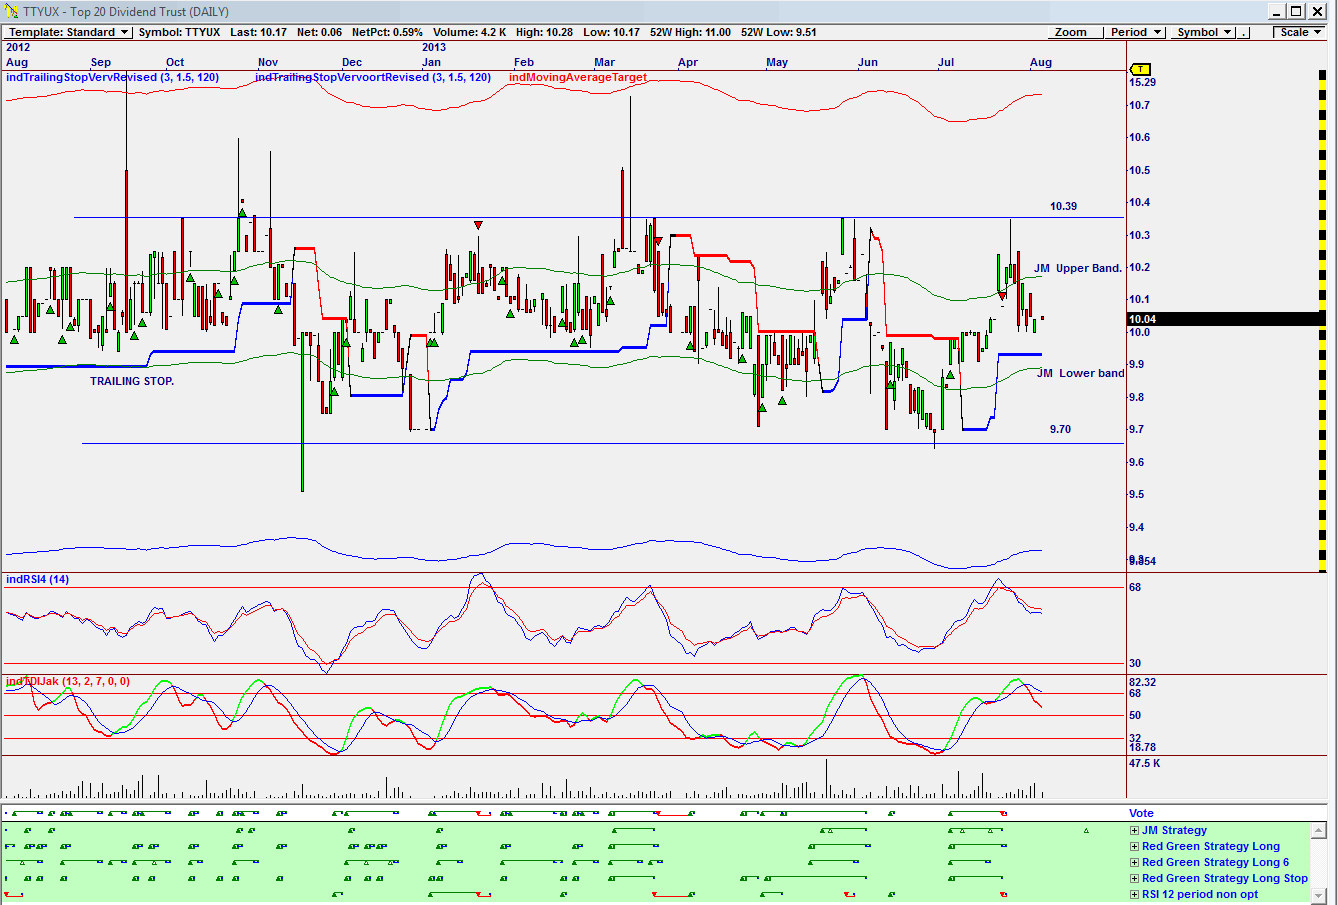
| Figure 1. Top 20 Dividend Trust. Daily Chart |
| Graphic provided by: Omnitrader. |
| |
| The chart in Figure 1 is a daily chart of Top 20 Dividend Trust. The chart shows how the share price has moved in a sideways trend between $9.70 and $10.39. Distributions will be declared and paid monthly on the Units. The Fund intends to pay equal monthly distributions (equal to one-twelfth of the annual targeted rate) initially expected to be $0.0583 per Unit (approximately $0.70 per annum, representing an annual cash distribution of 7.00% based on the $10.00 per Unit issue price). Looking at the chart, it's best to wait for the price to fall below the JM lower band (a 15-period simple moving average offset by 2% negative), collect the dividend, and then sell the share as it moves above the upper JM Band. You could also follow the buy signals on the Vote line, a summation of the five strategies shown in green below the vote line, and sell as the price falls below the trailing stop. The two indicators could also be used to suggest buy/sell signals. The objective is to receive the highest % yield possible and also benefit from share growth. |

|
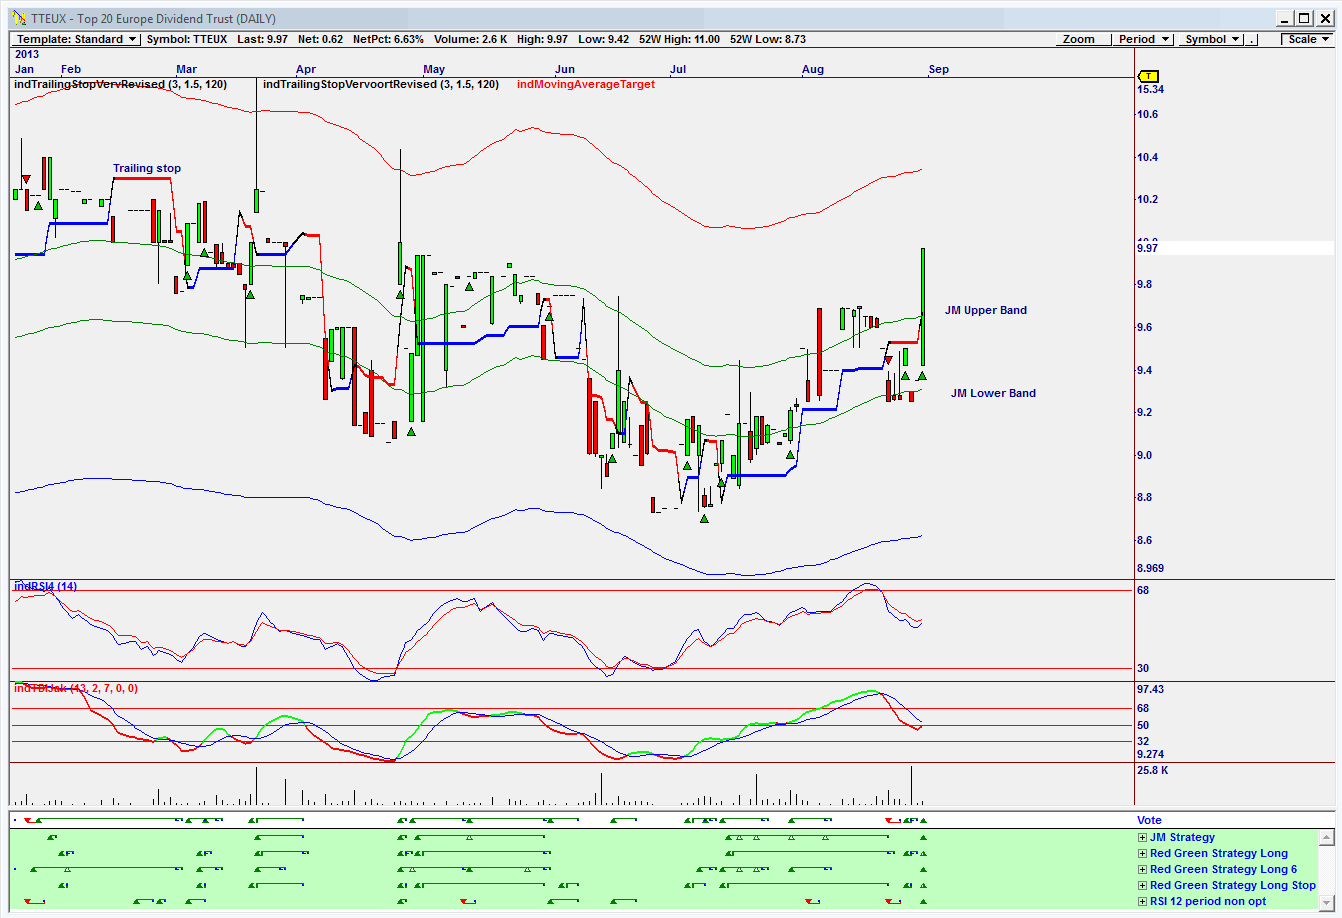
| Figure 2. Top 20 Europe Dividend Trust. Daily chart |
| Graphic provided by: Omnitrader. |
| |
| Figure 2 is a daily chart of the Top 20 EUROPE Dividend Trust. The Fund intends to make quarterly cash distributions to unitholders of record on the last business day of each calendar quarter. The fund intends to pay equal quarterly distributions initially expected to be $0.1625 per Unit (approximately $0.65 per annum) representing an annual yield of 6.5% on the issue price, consisting primarily of returns of capital and capital gains. Once again, you would buy the share when the price moves below the lower band and the Vote line suggests a buy signal, and sell the share when the price is above the upper JM Band, and the indicators suggest a sell signal, or sell when the price moves below the trailing stop. Once again the objective is to receive the highest % yield possible, but on a quarterly basis. |

|
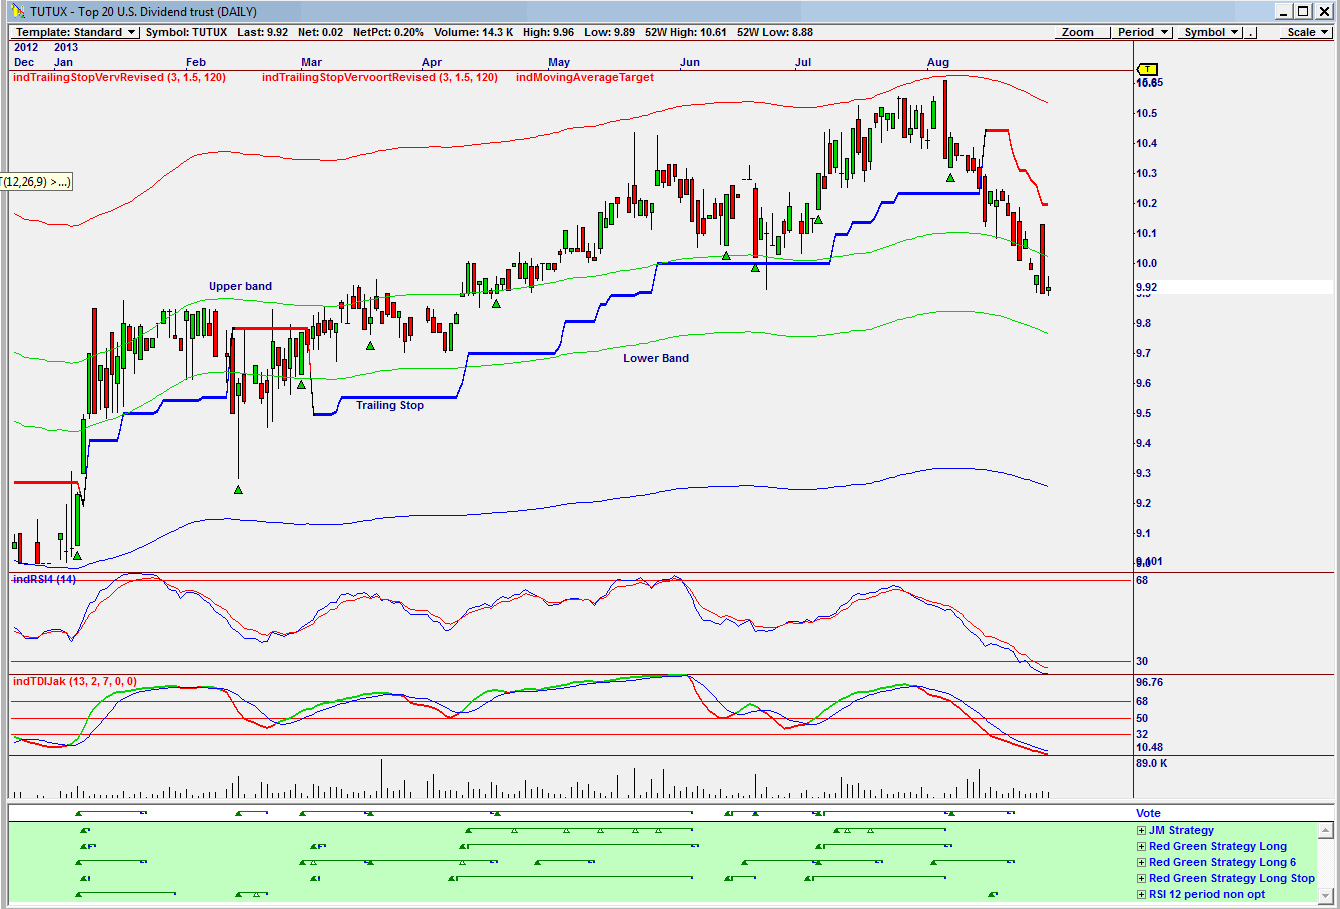
| Figure 3 Top 20 U.S.Dividend Trust Daily Chart |
| Graphic provided by: Omnitrader. |
| |
| Figure 3 is a daily chart of Top 20 US Dividend Trust. The Fund intends to pay equal monthly distributions (equal to one-twelfth of the annual targeted rate) initially expected to be $0.0417 per Class A Unit and US$0.0417 per Class U Unit (approximately $0.50 and US$0.50 per annum, respectively) representing an annual yield of 5.00% on the issue price, consisting primarily of returns of capital which are not immediately taxable but which reduce a unitholder's adjusted cost base of its Units. Once again, you would buy the share when the price is below the lower JM Band and sell when it is above the upper band on a sell signal, or sell as the price moves below the trailing stop. You could also buy the share when the Vote line suggests a buy, and sell when the two indicators suggest a sell. All three shares offer an attractive and enticing yield. You could buy and hold rather than trade the shares looking for growth income as well as yield. Wait for the share price to fall below the lower band, and then when the Vote line or an indicator suggests a buy, then buy and hold. |
Has been a technical analyst since 1969, and has worked as a futures and options trader with First Financial Futures in Johannesburg, South Africa.
| Address: | 3256 West 24th Ave |
| Vancouver, BC | |
| Phone # for sales: | 6042634214 |
| E-mail address: | petroosp@gmail.com |
Click here for more information about our publications!
PRINT THIS ARTICLE

|

Request Information From Our Sponsors
- StockCharts.com, Inc.
- Candle Patterns
- Candlestick Charting Explained
- Intermarket Technical Analysis
- John Murphy on Chart Analysis
- John Murphy's Chart Pattern Recognition
- John Murphy's Market Message
- MurphyExplainsMarketAnalysis-Intermarket Analysis
- MurphyExplainsMarketAnalysis-Visual Analysis
- StockCharts.com
- Technical Analysis of the Financial Markets
- The Visual Investor
- VectorVest, Inc.
- Executive Premier Workshop
- One-Day Options Course
- OptionsPro
- Retirement Income Workshop
- Sure-Fire Trading Systems (VectorVest, Inc.)
- Trading as a Business Workshop
- VectorVest 7 EOD
- VectorVest 7 RealTime/IntraDay
- VectorVest AutoTester
- VectorVest Educational Services
- VectorVest OnLine
- VectorVest Options Analyzer
- VectorVest ProGraphics v6.0
- VectorVest ProTrader 7
- VectorVest RealTime Derby Tool
- VectorVest Simulator
- VectorVest Variator
- VectorVest Watchdog
