

HOT TOPICS LIST
- MACD
- Fibonacci
- RSI
- Gann
- ADXR
- Stochastics
- Volume
- Triangles
- Futures
- Cycles
- Volatility
- ZIGZAG
- MESA
- Retracement
- Aroon
INDICATORS LIST
LIST OF TOPICS
PRINT THIS ARTICLE
by Donald W. Pendergast, Jr.
Shares of Equinix, Inc. are rallying again as a bullish price/money flow divergence has been playing out. Can it lock in more gains before a pause or reversal lower?
Position: N/A
Donald W. Pendergast, Jr.
Freelance financial markets writer and online publisher of the Trendzetterz.com S&P 500 Weekly Forecast service.
PRINT THIS ARTICLE
RSI
EQIX: Rising Higher, But Getting Overbought?
08/30/13 01:36:26 PMby Donald W. Pendergast, Jr.
Shares of Equinix, Inc. are rallying again as a bullish price/money flow divergence has been playing out. Can it lock in more gains before a pause or reversal lower?
Position: N/A
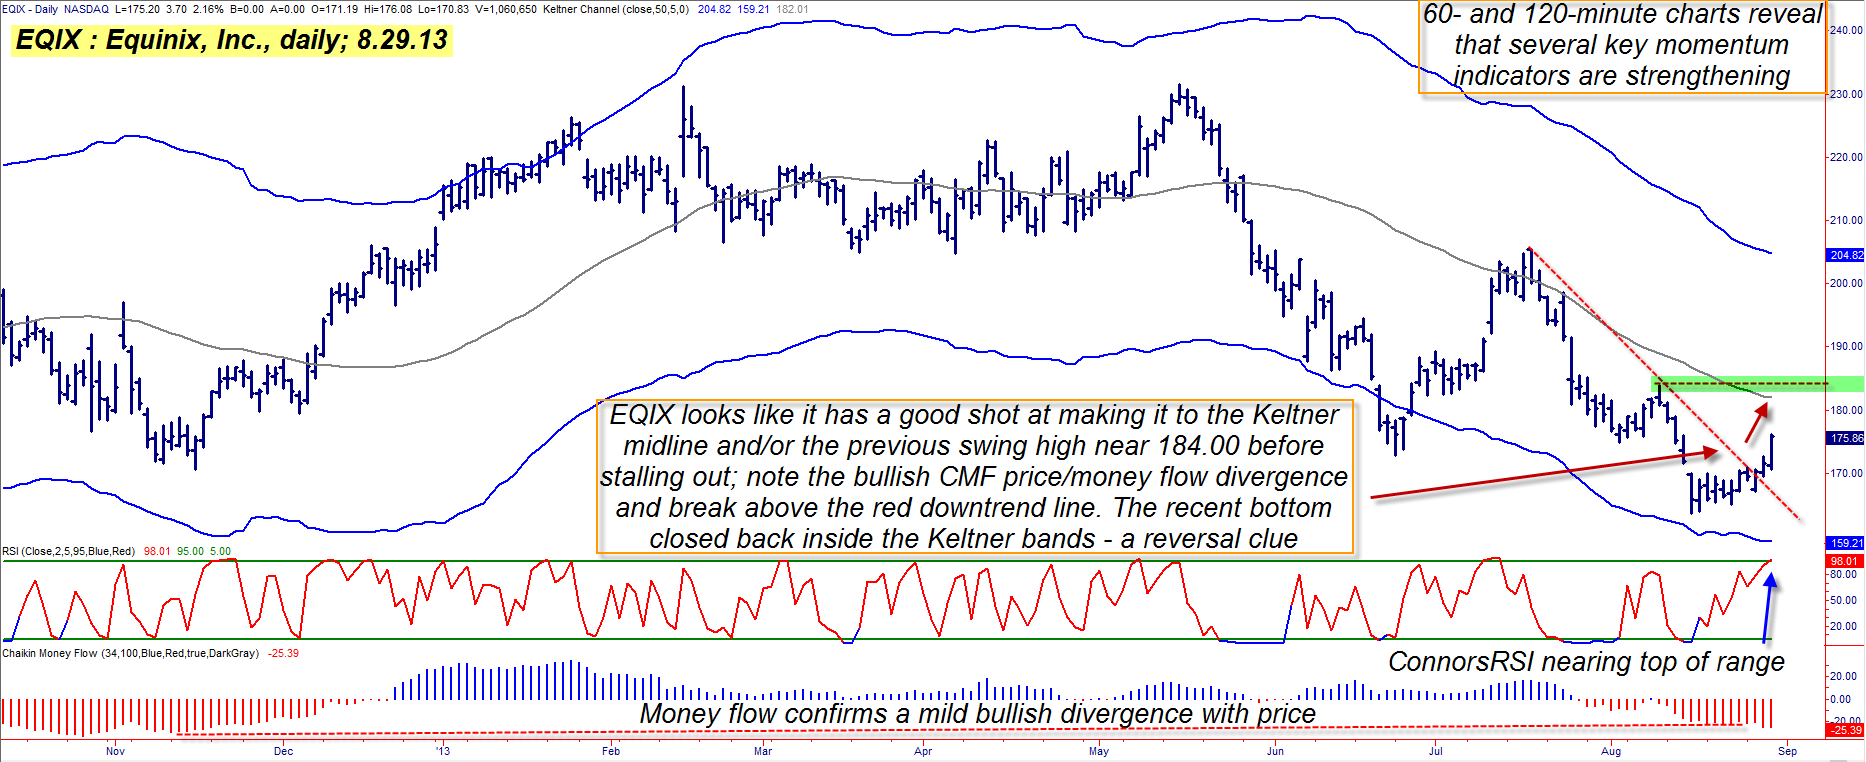
| Shares of Equinix Inc. (EQIX) tend to do a good job of producing a powerful multiday swing and/or multiweek trending move every few months, rewarding skilled traders with potential profits. The stock appears to be in the early stages of a bullish trend reversal — length and intensity unknown. While the stock may eventually recover much of its recent losses (down nearly 30% between May and August 2013), in the here and now it looks to be on track to make some more gains before hitting a strong area of chart resistance. Here's a closer look (Figure 1). |
|
| Figure 1. Keltner bands do a good job of helping traders understand price dynamics in stocks, commodities, and forex markets. These bands are set 5 ATRs away from a 50-day moving average. |
| Graphic provided by: TradeStation. |
| |
| EQIX topped out on May 15, 2013 at a price of 231.56 and then wasted little time enjoying the panoramic views afforded by such a lofty valuation; by the time August 15, 2013 rolled around, EQIX had been cut down to a value of 165.73. As disheartening as that plunge was to buy & hold type investors, to a skilled chartist, EQIX's price action had already confirmed that a reversal was likely after that major low (a multicycle low) was made: 1. Note that the first swing low during the decline (June 2013) bottomed out below the lower Keltner band, making four consecutive daily closes beneath it. 2. Then notice that the August 15, 2013 swing low completed entirely inside the lower Keltner band; this confirms that the selling panic (reflected in the daily volatility that the bands do a great job of defining) was beginning to subside. 3. Also note that at the time of the mid-August low, that the 34-day Chaikin Money flow (CMF)(34) histogram was starting to confirm a mild case of bullish price/money flow divergence. While witnessing all three clues is very helpful, pointing to an upcoming bullish turn (now underway), it remains that you still need for prices to bottom and then reverse higher before attempting to establish a new long position — trying to catch a "falling knife" such as a plunging stock can be a dangerous business after all. Well, EQIX has indeed made its bullish reversal, and with key momentum indicators on its 60- and 120-minute charts now suggesting yet another surge higher, it's a good time to examine if there is still opportunity to make some money in the stock before it makes its next swing high. |
|
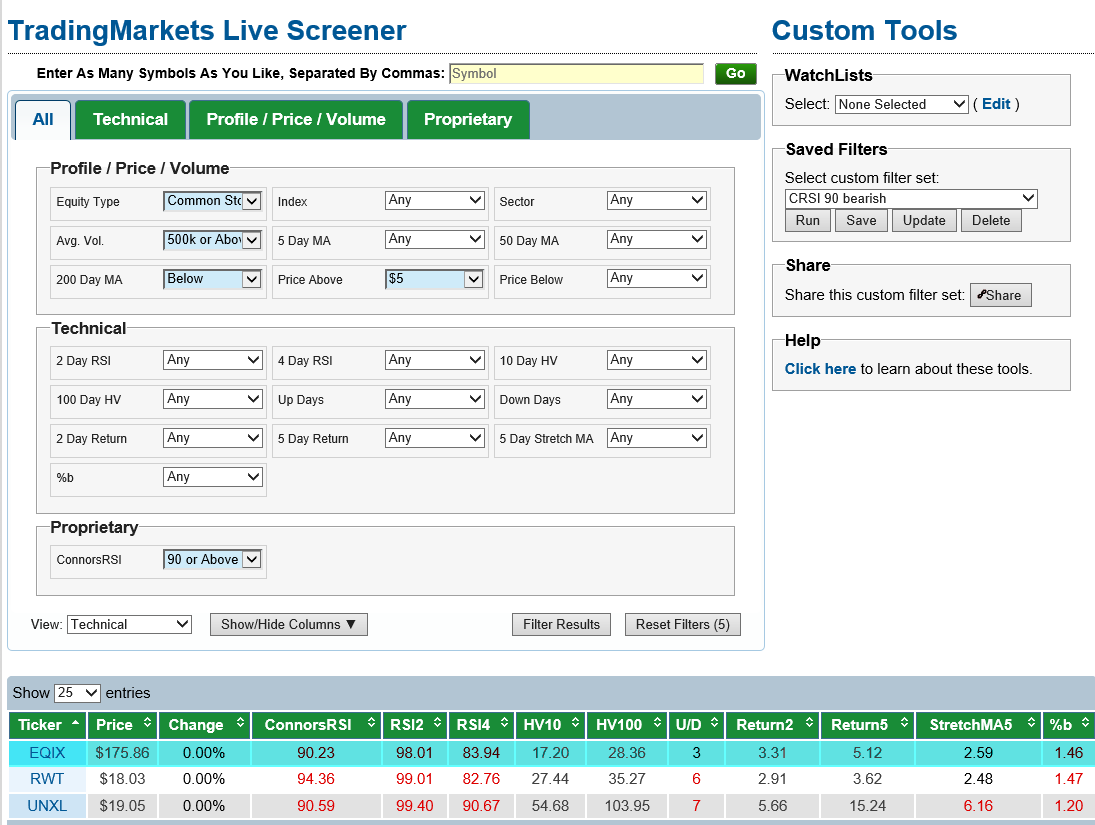
| Figure 2. The Live Screen identified EQIX and two other stocks as having strong bullish momentum, based on their respective ConnorsRSI readings. |
| Graphic provided by: TradeStation. |
| Graphic provided by: Trading Markets Live Screener. |
| |
| With EQIX just having broken above its red downtrend line, this looks like a good momentum play, one that goes something like this: 1. On a break above 176.10 look to go long with half your position, and then add the second half on a break above 177.00, immediately placing a stop loss near 170.75. 2. The nominal price target for this trade is 184.00 and the entire position should be closed if that price is reached. 3. A two-bar trailing stop of the daily lows should be used to manage the trade until either the price target is hit or you're stopped out. Since the reward-risk ratio of this trade is less than 2 to 1, keep your account risk a bit lower than 1%, perhaps .7 to .8%. It's uncertain if the major US stock indexes will be able to rebound or if the mid-week bounce was just a one-trick pony in the midst of an emerging bear market, but for those trading EQIX there does appear to be an above-average probability of more upside — enough to warrant taking a long entry on continued strength. Trade wisely until we meet here again. |
Freelance financial markets writer and online publisher of the Trendzetterz.com S&P 500 Weekly Forecast service.
| Title: | Market consultant and writer |
| Company: | Trendzetterz |
| Address: | 81 Hickory Hollow Drive |
| Crossville, TN 38555 | |
| Phone # for sales: | 904-303-4814 |
| Website: | trendzetterz.com |
| E-mail address: | support@trendzetterz.com |
Traders' Resource Links | |
| Trendzetterz has not added any product or service information to TRADERS' RESOURCE. | |
Click here for more information about our publications!
PRINT THIS ARTICLE

Request Information From Our Sponsors
- StockCharts.com, Inc.
- Candle Patterns
- Candlestick Charting Explained
- Intermarket Technical Analysis
- John Murphy on Chart Analysis
- John Murphy's Chart Pattern Recognition
- John Murphy's Market Message
- MurphyExplainsMarketAnalysis-Intermarket Analysis
- MurphyExplainsMarketAnalysis-Visual Analysis
- StockCharts.com
- Technical Analysis of the Financial Markets
- The Visual Investor
- VectorVest, Inc.
- Executive Premier Workshop
- One-Day Options Course
- OptionsPro
- Retirement Income Workshop
- Sure-Fire Trading Systems (VectorVest, Inc.)
- Trading as a Business Workshop
- VectorVest 7 EOD
- VectorVest 7 RealTime/IntraDay
- VectorVest AutoTester
- VectorVest Educational Services
- VectorVest OnLine
- VectorVest Options Analyzer
- VectorVest ProGraphics v6.0
- VectorVest ProTrader 7
- VectorVest RealTime Derby Tool
- VectorVest Simulator
- VectorVest Variator
- VectorVest Watchdog