HOT TOPICS LIST
- MACD
- Fibonacci
- RSI
- Gann
- ADXR
- Stochastics
- Volume
- Triangles
- Futures
- Cycles
- Volatility
- ZIGZAG
- MESA
- Retracement
- Aroon
INDICATORS LIST
LIST OF TOPICS
PRINT THIS ARTICLE
by Koos van der Merwe
Walk into any McDonald's and you always have to stand in line to be served.
Position: Buy
Koos van der Merwe
Has been a technical analyst since 1969, and has worked as a futures and options trader with First Financial Futures in Johannesburg, South Africa.
PRINT THIS ARTICLE
ELLIOTT WAVE
Looking At McDonald's
09/04/13 03:29:49 PMby Koos van der Merwe
Walk into any McDonald's and you always have to stand in line to be served.
Position: Buy
| The best way to judge a business is to park your car in the street outside, and count the number of people walking into the store. With McDonald's, you must count the number of people waiting to be served. There are usually too many entrances to watch. I enjoy visiting McDonald's; I enjoy their fries and chicken wrap. I also enjoy counting the number of children and the number of Seniors eating there. It makes me feel like I am investing in the Warren Buffett way, and deciding whether McDonald's (MCD) is a Buffett stock worth the investment. The company does exhibit many of the characteristics of a Buffett investment; consistent or growing earnings, high returns on equity with limited debt, solid management, and a simple straight forward business. |

|
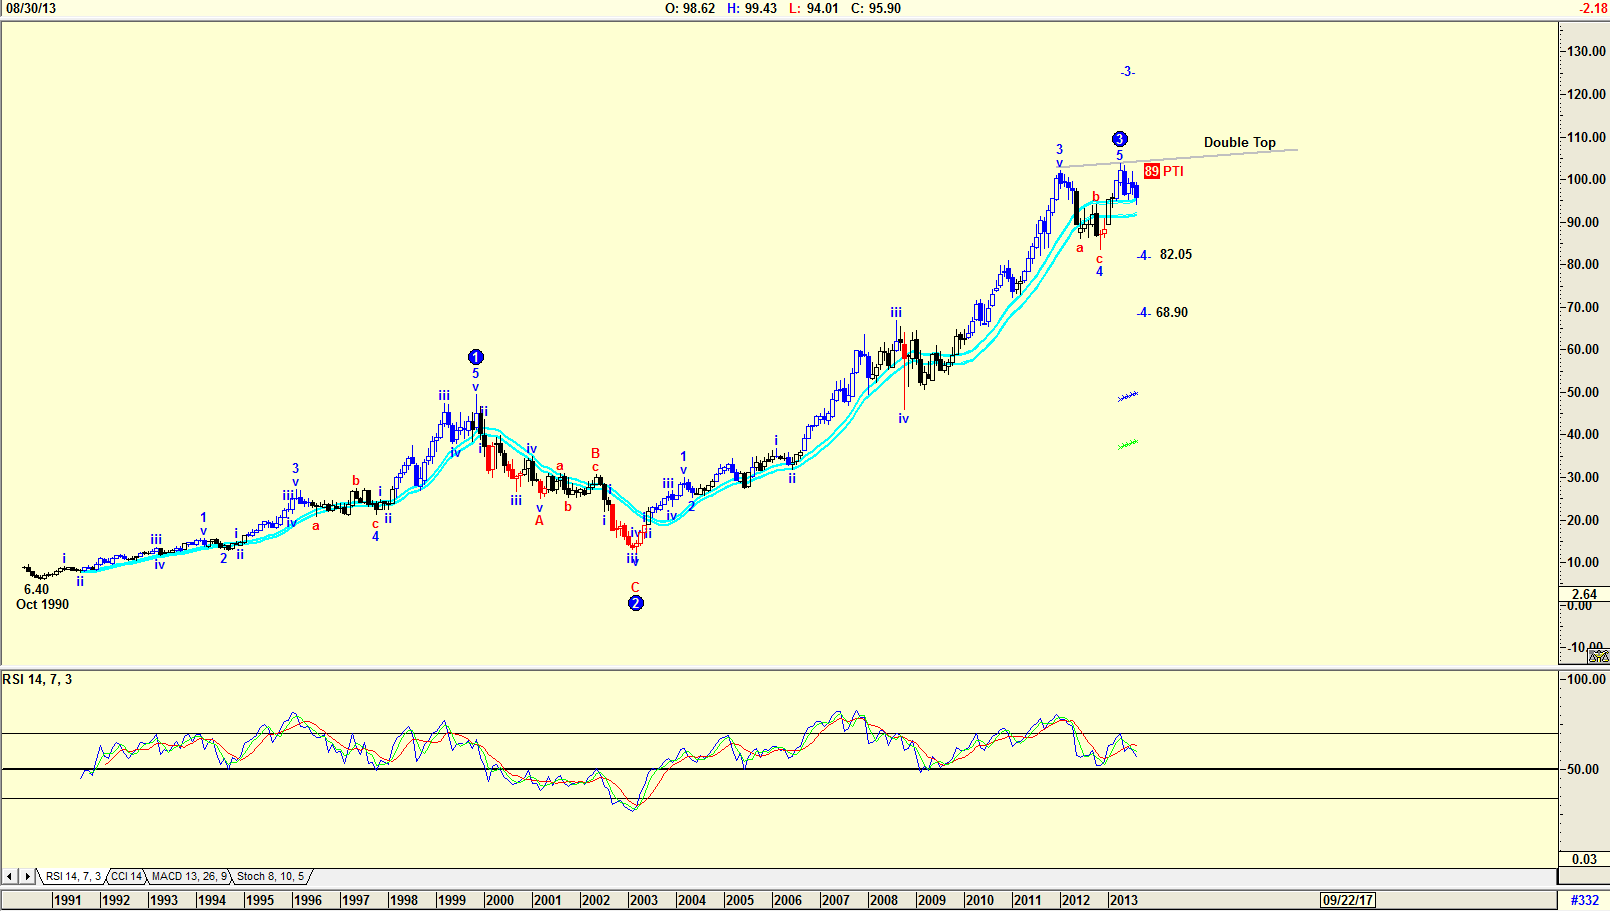
| Figure 1. Monthly chart showing Elliott Wave count. |
| Graphic provided by: AdvancedGET. |
| |
| The monthly chart in Figure 1 of MCD shows how the price rose from a low of $6.40 in October 1990 to its present price of $95.90. The Elliott Wave count shown on the chart suggests the price may have completed a WAVE 3 Elliott count, and could be correcting in a WAVE 4. This is confirmed by the RSI indicator which is trending down and by the PTI (Probability Index) of 89. The double top that has formed is further confirmation of a correction. The Advanced GET program is suggesting a WAVE 4 target of $82.05 or $68.90. |

|
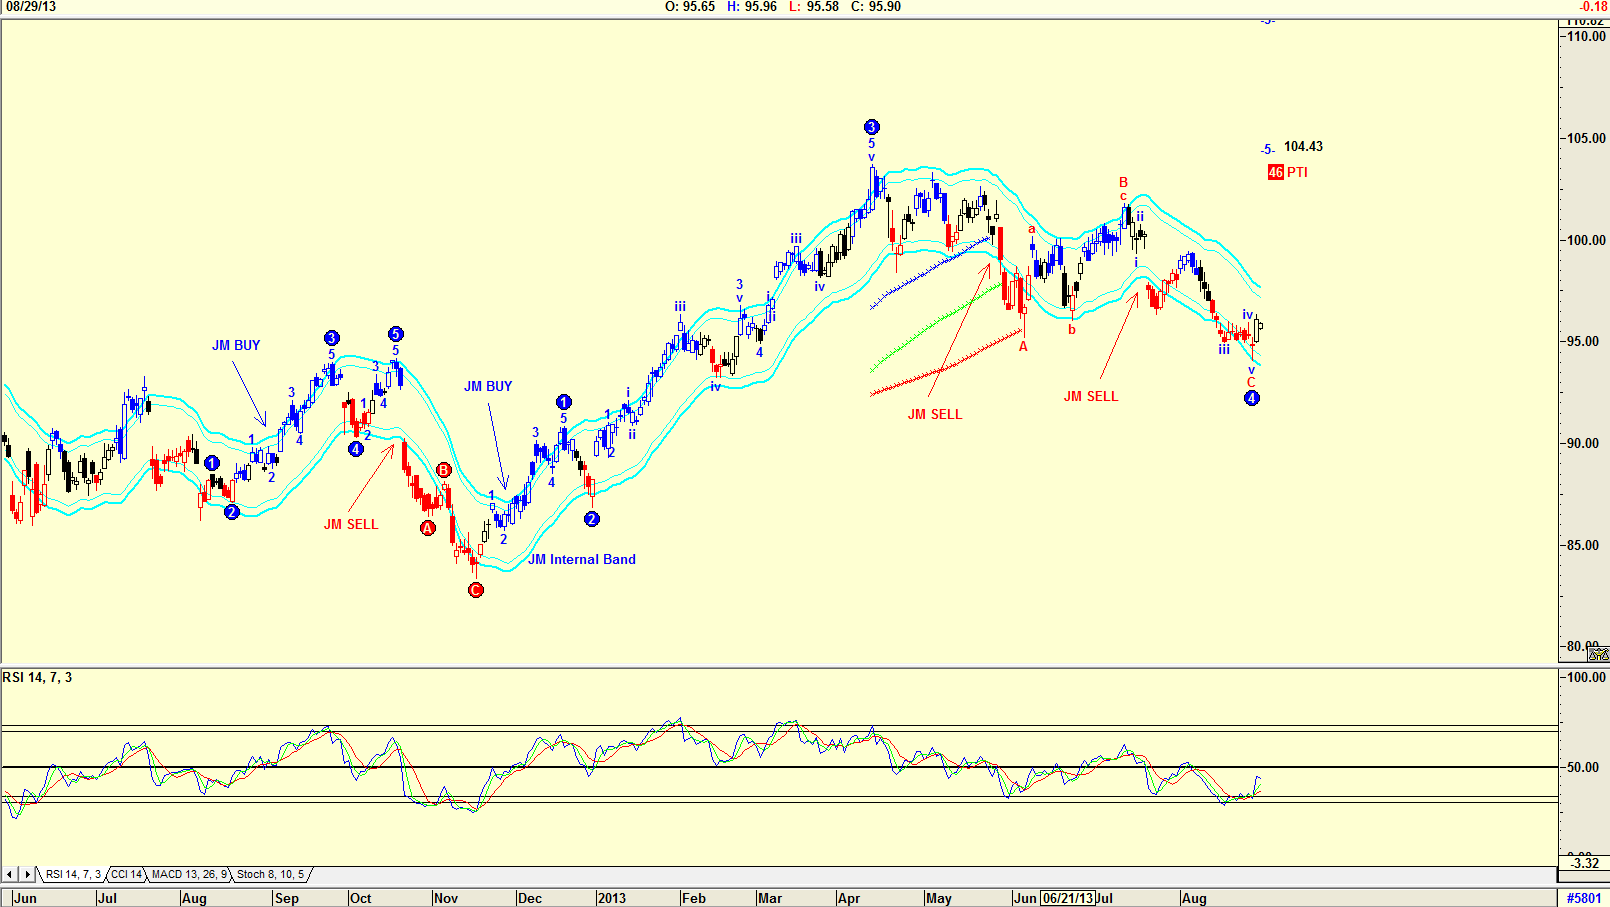
| Figure 2. Daily chart showing Elliott Wave count and target. |
| Graphic provided by: AdvancedGET. |
| |
| The chart in Figure 2 is a daily chart, with an Elliott Wave count suggesting that the share price has completed a WAVE 4 and should now start rising into a WAVE 5 with a target of $104.43. The RSI indicator on the daily chart is suggesting a buy signal. The chart also shows the JM Internal Band indicator which is not yet giving a buy signal. The JM Internal Band indicator is a 15-period simple moving average offset by 2% positive and 2% negative. Conservative investors could wait for the share price to break above the upper JM Internal Band before buying. |

|
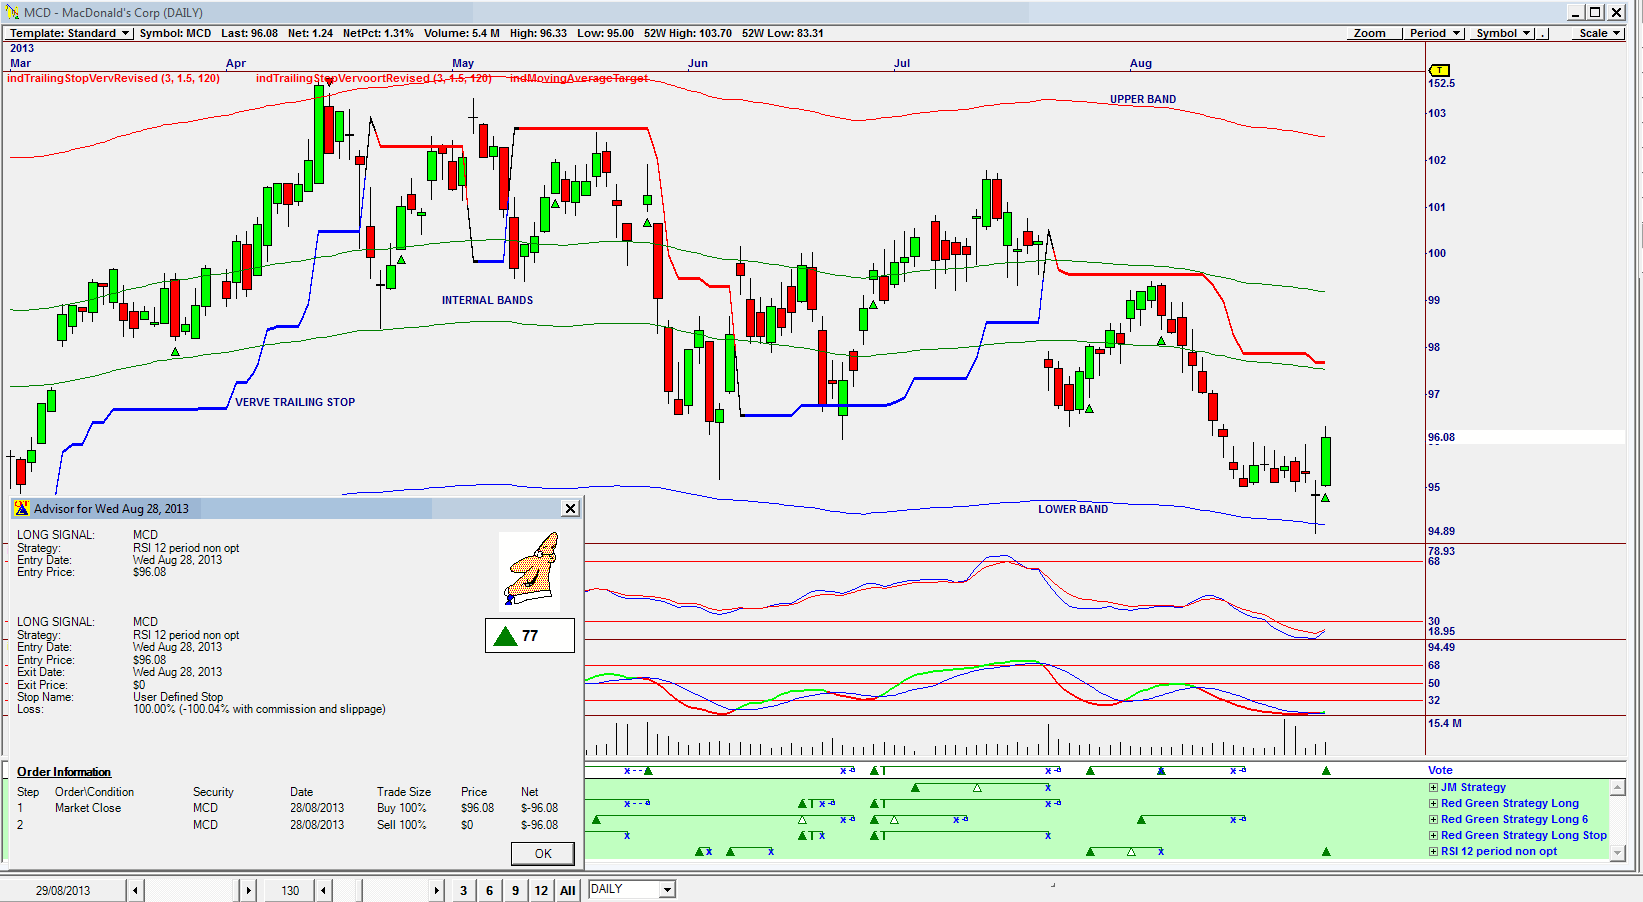
| Figure 3. Omnitrader chart showing strong buy signal given. |
| Graphic provided by: Omnitrader.. |
| |
| My final chart is an Omnitrader chart that brought the share to my attention. A buy signal was given on Wednesday August 28, 2013 with an Advisor rating as shown of 77. This is a strong rating and is based solely on the RSI 12 period strategy as shown in the green area below the VOTE line. That the share price bounced off the lower band, is also a strong positive. I would be a buyer of MCD for a long-term hold, but I would keep my eye on the target prices suggested by the charts of Figure 1 and Figure 2. Short-term traders could watch closely as the price approaches the upper band, as shown in Figure 3 and hold the stock waiting for a sell signal, which would be when the share price falls below the VERVE trailing stop. |
Has been a technical analyst since 1969, and has worked as a futures and options trader with First Financial Futures in Johannesburg, South Africa.
| Address: | 3256 West 24th Ave |
| Vancouver, BC | |
| Phone # for sales: | 6042634214 |
| E-mail address: | petroosp@gmail.com |
Click here for more information about our publications!
PRINT THIS ARTICLE

Request Information From Our Sponsors
- StockCharts.com, Inc.
- Candle Patterns
- Candlestick Charting Explained
- Intermarket Technical Analysis
- John Murphy on Chart Analysis
- John Murphy's Chart Pattern Recognition
- John Murphy's Market Message
- MurphyExplainsMarketAnalysis-Intermarket Analysis
- MurphyExplainsMarketAnalysis-Visual Analysis
- StockCharts.com
- Technical Analysis of the Financial Markets
- The Visual Investor
- VectorVest, Inc.
- Executive Premier Workshop
- One-Day Options Course
- OptionsPro
- Retirement Income Workshop
- Sure-Fire Trading Systems (VectorVest, Inc.)
- Trading as a Business Workshop
- VectorVest 7 EOD
- VectorVest 7 RealTime/IntraDay
- VectorVest AutoTester
- VectorVest Educational Services
- VectorVest OnLine
- VectorVest Options Analyzer
- VectorVest ProGraphics v6.0
- VectorVest ProTrader 7
- VectorVest RealTime Derby Tool
- VectorVest Simulator
- VectorVest Variator
- VectorVest Watchdog
