HOT TOPICS LIST
- MACD
- Fibonacci
- RSI
- Gann
- ADXR
- Stochastics
- Volume
- Triangles
- Futures
- Cycles
- Volatility
- ZIGZAG
- MESA
- Retracement
- Aroon
INDICATORS LIST
LIST OF TOPICS
PRINT THIS ARTICLE
by Donald W. Pendergast, Jr.
Still outperforming the S&P 500 index over the past three months, shares of Juniper Networks appear to be close to a major support area and possible bullish reversal.
Position: N/A
Donald W. Pendergast, Jr.
Freelance financial markets writer and online publisher of the Trendzetterz.com S&P 500 Weekly Forecast service.
PRINT THIS ARTICLE
RSI
JNPR: Swing Buy Setup Approaching?
08/28/13 03:43:12 PMby Donald W. Pendergast, Jr.
Still outperforming the S&P 500 index over the past three months, shares of Juniper Networks appear to be close to a major support area and possible bullish reversal.
Position: N/A
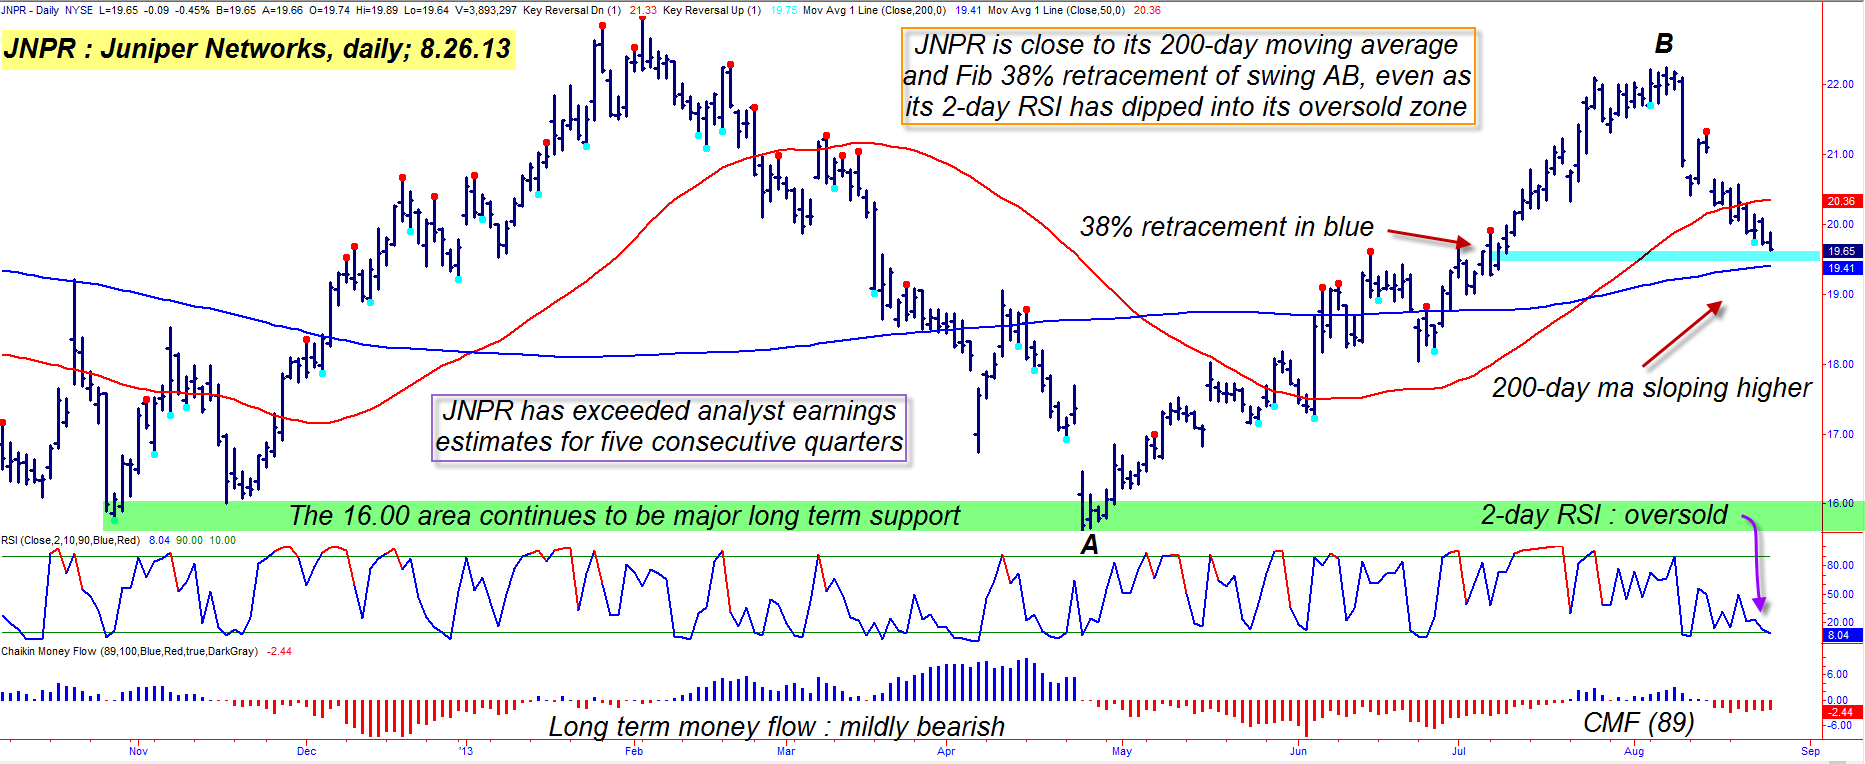
| Shares of Juniper Networks (JNPR) still tend to make nice swing moves on its 30-, 60-, 120-minute, and daily time frames, and skilled traders may soon be offered another opportunity to place long trades in this large-cap tech equipment manufacturer's stock. Here's a closer look using JNPR's daily chart (Figure 1). |

|
| Figure 1. Juniper Networks (JNPR) is now trading at Fibonacci 38% support and its 200-day moving average; any soon appearance of a key reversal bar may be all the incentive that the bulls need to pile back into this fundamentally sound stock that keeps on beating its earnings estimates. |
| Graphic provided by: TradeStation. |
| Graphic provided by: ConnorsRSI from Connors Research LLC. |
| |
| Before starting in with the technical case for a near-term rally in JNPR, be aware that the major US stock indexes are still very vulnerable to more selling as we head into September — one of the most historically volatile market months of all — and that traders need to focus solely on low-risk long entries in fundamentally strong, high relative strength stocks only, and with a modest account risk of no more than 1% maximum per trade. That said, what you see here is a downright compelling chart for swing traders to consider: 1. Juniper Networks has beat analyst earnings estimates for the last five quarters; the smallest increase was 17% and the largest was 40%. 2. The stock is outperforming the S&P 500 index (.SPX) over the past 13 weeks. 3. JNPR is now trading close to two major support levels; it's completed a 38% retracement of major swing AB and is trading just a few cents above its all-important 200-day moving average (blue line). 4. Its two-day RSI indicator is now below 10.00; look for this to decline further, perhaps below 5.00 if JNPR finally touches the 200-day average. 5. The long-term money flow histogram is below its zero line, but not so far as to preclude the possibility of a strong relief rally from major support. |

|
| Figure 2. JNPR, along with several other high-volume, large cap stocks, has a 2-day RSI reading below 10.00. Readings below 5.00 that are followed by a key reversal bar and subsequent break higher can often trigger a profitable bullish swing move. |
| Graphic provided by: TradeStation. |
| Graphic provided by: TradeStation Radar Screen. |
| |
| Basically what traders need to see happen before attempting a long swing entry is this: A. The 200-day average needs to hold, with JNPR closing above it as the final low is made. B. A reversal bar needs to print after the 200-day average is hit. C. Look to enter a long trade as the high of such a reversal bar is exceeded. Keep your account risk at 1% (or even a little less) and begin managing the position with a three-bar trailing stop of the daily lows. The underside of the red 50-day moving average is a rational price target for such a swing move (near 20.38 right now) and that would be a really good place to simply close the trade and get back to the safety of cash. Keep in mind that if JNPR doesn't bottom out at the 200-day average, a larger-scale bear move is likely underway; in such a case, keep waiting for the reversal bar to form on the way down, followed by a break back above it, as you can then enter a long position the same way described above. You may need to adjust the profit target somewhat, however, depending on how far down the stock actually drops before finding heavy demand from buyers. Trade wisely until we meet here again. |
Freelance financial markets writer and online publisher of the Trendzetterz.com S&P 500 Weekly Forecast service.
| Title: | Market consultant and writer |
| Company: | Trendzetterz |
| Address: | 81 Hickory Hollow Drive |
| Crossville, TN 38555 | |
| Phone # for sales: | 904-303-4814 |
| Website: | trendzetterz.com |
| E-mail address: | support@trendzetterz.com |
Traders' Resource Links | |
| Trendzetterz has not added any product or service information to TRADERS' RESOURCE. | |
Click here for more information about our publications!
Comments

Request Information From Our Sponsors
- StockCharts.com, Inc.
- Candle Patterns
- Candlestick Charting Explained
- Intermarket Technical Analysis
- John Murphy on Chart Analysis
- John Murphy's Chart Pattern Recognition
- John Murphy's Market Message
- MurphyExplainsMarketAnalysis-Intermarket Analysis
- MurphyExplainsMarketAnalysis-Visual Analysis
- StockCharts.com
- Technical Analysis of the Financial Markets
- The Visual Investor
- VectorVest, Inc.
- Executive Premier Workshop
- One-Day Options Course
- OptionsPro
- Retirement Income Workshop
- Sure-Fire Trading Systems (VectorVest, Inc.)
- Trading as a Business Workshop
- VectorVest 7 EOD
- VectorVest 7 RealTime/IntraDay
- VectorVest AutoTester
- VectorVest Educational Services
- VectorVest OnLine
- VectorVest Options Analyzer
- VectorVest ProGraphics v6.0
- VectorVest ProTrader 7
- VectorVest RealTime Derby Tool
- VectorVest Simulator
- VectorVest Variator
- VectorVest Watchdog
