HOT TOPICS LIST
- MACD
- Fibonacci
- RSI
- Gann
- ADXR
- Stochastics
- Volume
- Triangles
- Futures
- Cycles
- Volatility
- ZIGZAG
- MESA
- Retracement
- Aroon
INDICATORS LIST
LIST OF TOPICS
PRINT THIS ARTICLE
by David Penn
Rebounding from a seven-month downtrend, livestock futures finally start moving up.
Position: N/A
David Penn
Technical Writer for Technical Analysis of STOCKS & COMMODITIES magazine, Working-Money.com, and Traders.com Advantage.
PRINT THIS ARTICLE
CHART ANALYSIS
Live Cattle's Cup with Handle Bottom
09/19/02 11:24:43 AMby David Penn
Rebounding from a seven-month downtrend, livestock futures finally start moving up.
Position: N/A
| One of the more helpful ways of looking at the CRB futures is to look at the subgroups, as well. Because of the weighting of the CRB Index, any given subgroup—from energies to agriculturals to precious metals to livestock—may be the one powering a bull market or leading the way down in a bear market. Additionally, the CRB subgroups are the "sectors" of the commodities market—much like sectors in the stock market. By analyzing the sectors, not only does a trader have a good sense of the market as a whole, but also a trader can find particularly good opportunities among the various constituencies of the subgroups. |
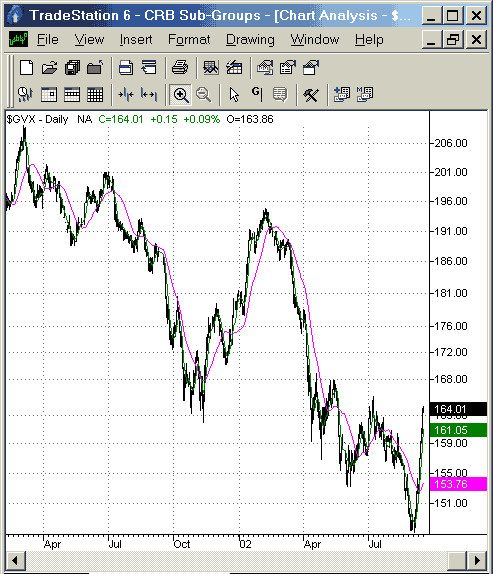
| An excellent example of this might be found in the livestock futures subgroup ($GVX). Note that the livestock subgroup has been in a downtrend since the beginning of 2002. In fact, the downtrend since 2002 is really the second leg of a downtrend that began in April 2001—as the chart shows. The chart of this approximately 18-month bear market suggests that livestock prices have fallen in the neighborhood of 27% from their spring 2001 peak. The chart also shows a major countertrend rally in the third quarter of 2001, which brought the livestock subgroup up some 18% before collapsing and resuming the downtrend in 2002. |

|
| Figure 1: Livestock futures have been trending down since April 2001. |
| Graphic provided by: TradeStation. |
| |
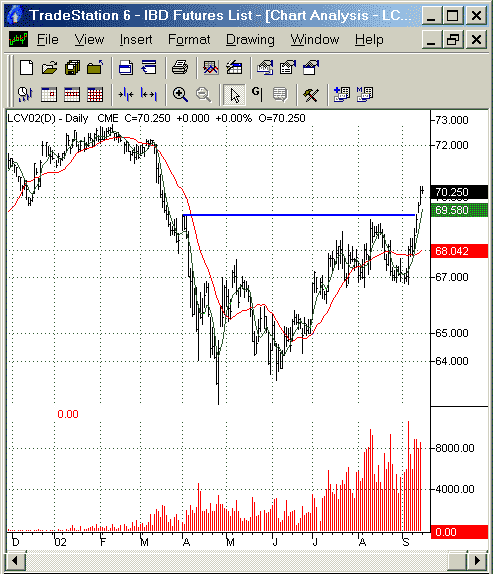
| This longer-term view is helpful when considering the October live cattle futures contract, which has been forming a base for the past four months. Comparing the chart of the October live cattle futures contract to that of the livestock subgroup, note that while the subgroup put in a bottom in the second quarter of 2002 and a lower bottom in the summer of 2002 before rallying, October live cattle put in a bottom in the second quarter of 2002 and a HIGHER bottom in the summer of 2002. |
 Figure 2: October live cattle breaks to the upside in September after a four-month basing period. The second higher bottom in the summer is the important one. Not only does it serve as the "launching pad" for the rally that begins in September, but also it provides support should the rally fail. The two-month consolidation in July and August makes it all the more likely that the lows of April, May and June are real bottoms. |
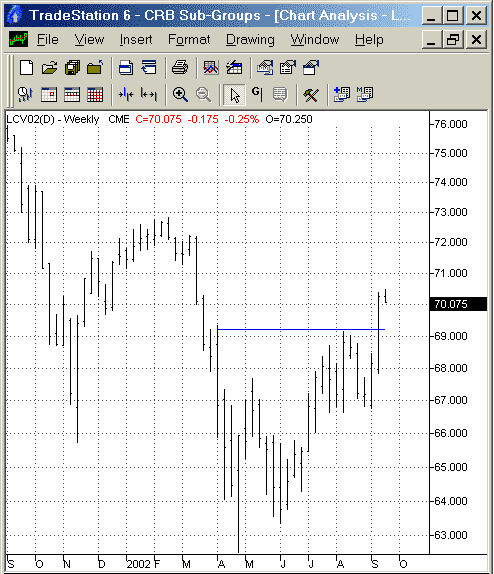
The overall April to September consolidation has taken on an interesting cup with handle shape, as well. The cup with handle formation was popularized by William O'Neil in his book "How to Make Money in Stocks." Essentially, the cup with handle consists of a rounding bottom (the cup) that is followed by a small, brief correction (the handle) before prices move up and away from the formation. In the case of the cup with handle in October live cattle, the cup part of the formation extends from the beginning of April to the beginning of August, with the handle part of the formatoin extending from the beginning of August to the break on the upside in mid-September. Figure 3: This weekly chart shows the resistance to the live cattle advance begins around 73. The size of the formation suggests that October live cattle prices could likely advance to a nearby price target of 75. This comes from subtracting the formation low (63.3) from the formation high (69.2) and adding that difference to the value at the formation high. Looking to a weekly chart of October live cattle futures, we see that successfully reaching this price target would mean a new year-to-date high for live cattle. |
Technical Writer for Technical Analysis of STOCKS & COMMODITIES magazine, Working-Money.com, and Traders.com Advantage.
| Title: | Technical Writer |
| Company: | Technical Analysis, Inc. |
| Address: | 4757 California Avenue SW |
| Seattle, WA 98116 | |
| Phone # for sales: | 206 938 0570 |
| Fax: | 206 938 1307 |
| Website: | www.Traders.com |
| E-mail address: | DPenn@traders.com |
Traders' Resource Links | |
| Charting the Stock Market: The Wyckoff Method -- Books | |
| Working-Money.com -- Online Trading Services | |
| Traders.com Advantage -- Online Trading Services | |
| Technical Analysis of Stocks & Commodities -- Publications and Newsletters | |
| Working Money, at Working-Money.com -- Publications and Newsletters | |
| Traders.com Advantage -- Publications and Newsletters | |
| Professional Traders Starter Kit -- Software | |
Click here for more information about our publications!
PRINT THIS ARTICLE

Request Information From Our Sponsors
- StockCharts.com, Inc.
- Candle Patterns
- Candlestick Charting Explained
- Intermarket Technical Analysis
- John Murphy on Chart Analysis
- John Murphy's Chart Pattern Recognition
- John Murphy's Market Message
- MurphyExplainsMarketAnalysis-Intermarket Analysis
- MurphyExplainsMarketAnalysis-Visual Analysis
- StockCharts.com
- Technical Analysis of the Financial Markets
- The Visual Investor
- VectorVest, Inc.
- Executive Premier Workshop
- One-Day Options Course
- OptionsPro
- Retirement Income Workshop
- Sure-Fire Trading Systems (VectorVest, Inc.)
- Trading as a Business Workshop
- VectorVest 7 EOD
- VectorVest 7 RealTime/IntraDay
- VectorVest AutoTester
- VectorVest Educational Services
- VectorVest OnLine
- VectorVest Options Analyzer
- VectorVest ProGraphics v6.0
- VectorVest ProTrader 7
- VectorVest RealTime Derby Tool
- VectorVest Simulator
- VectorVest Variator
- VectorVest Watchdog
