HOT TOPICS LIST
- MACD
- Fibonacci
- RSI
- Gann
- ADXR
- Stochastics
- Volume
- Triangles
- Futures
- Cycles
- Volatility
- ZIGZAG
- MESA
- Retracement
- Aroon
INDICATORS LIST
LIST OF TOPICS
PRINT THIS ARTICLE
by Koos van der Merwe
On July 14, 2013, I wrote asking whether it was time to start reinvesting in the realty market. I concluded that it was a must and Duke Realty Corporation (DRE) did recover, but then promptly fell more than its recovery. Is it a must again or is DRE an exception?
Position: Buy
Koos van der Merwe
Has been a technical analyst since 1969, and has worked as a futures and options trader with First Financial Futures in Johannesburg, South Africa.
PRINT THIS ARTICLE
ELLIOTT WAVE
Another Look At Duke Realty Corporation
08/28/13 03:37:06 PMby Koos van der Merwe
On July 14, 2013, I wrote asking whether it was time to start reinvesting in the realty market. I concluded that it was a must and Duke Realty Corporation (DRE) did recover, but then promptly fell more than its recovery. Is it a must again or is DRE an exception?
Position: Buy
| We all know about the U.S. subprime mortgage crises, a set of events and conditions that led to a financial crises and recession that started in 2008. Mortgage-backed securities (MBS) initially offered attractive rates of return due to the higher interest rates on the mortgages; however, the lower credit quality ultimately caused massive defaults. U.S. home prices declined steeply after peaking in mid-2006 with borrowers' ability to refinance their loans becoming more difficult. The bursting of the housing bubble in the US resulted in approximately 23% of U.S. homes to enter foreclosure. Now, with the economy slowly recovering, home buyers are slowly re-entering the market. Shares of DRE, a commercial real estate firm is slowly starting to recover and could be considered an addition to your long-term portfolio. |

|
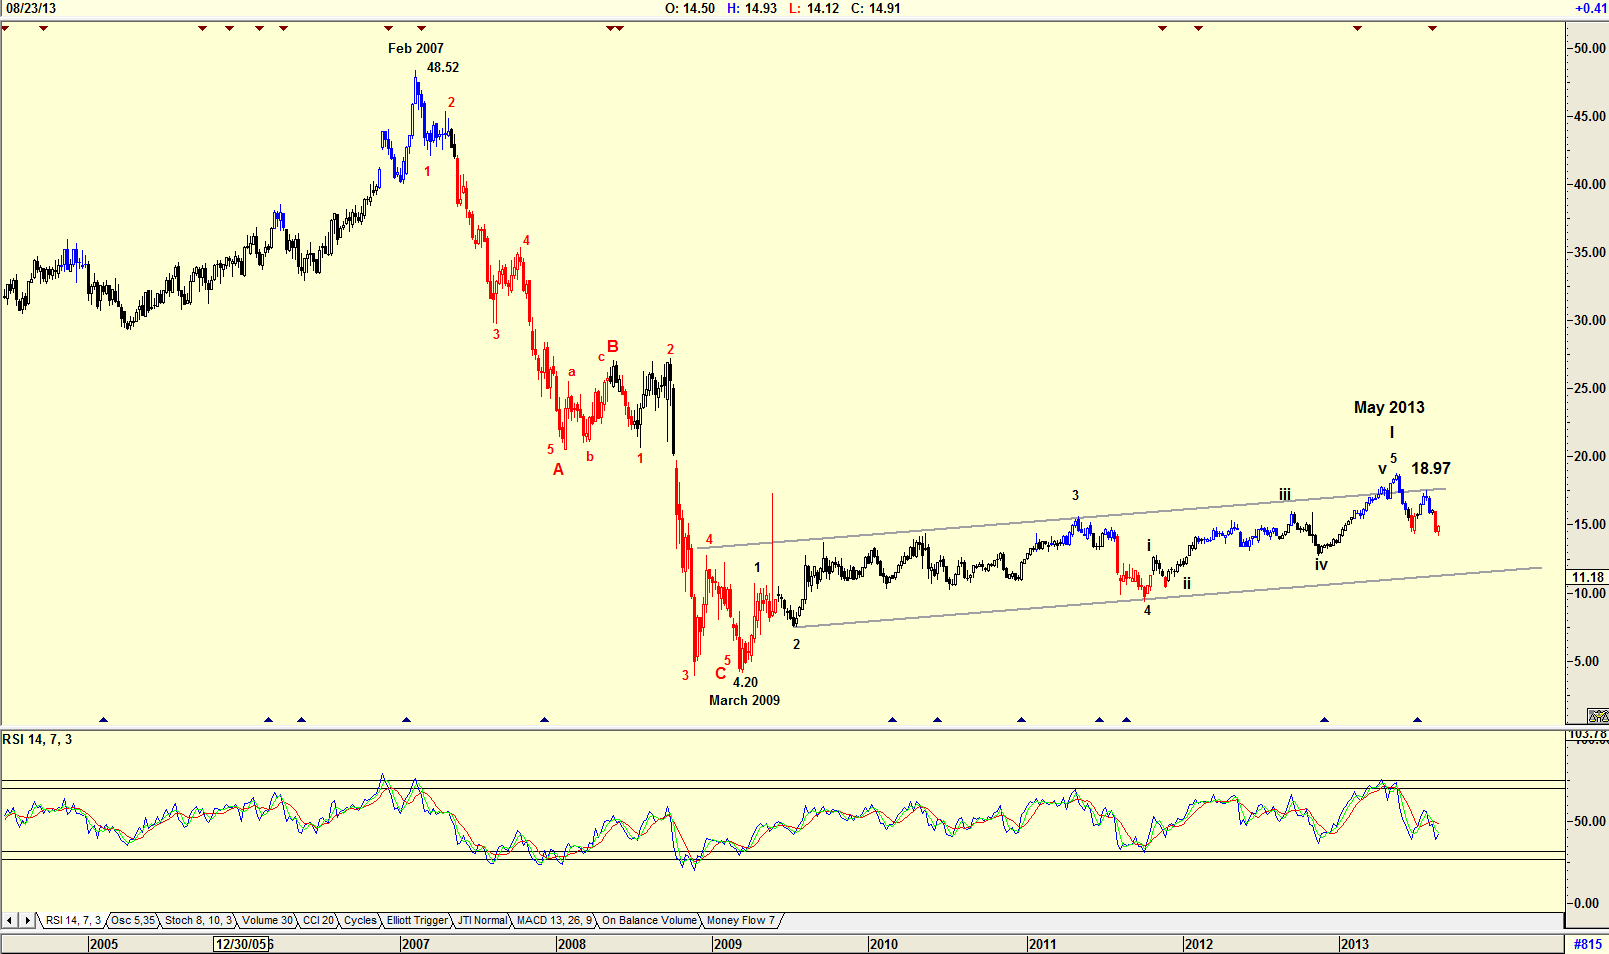
| Figure 1. Weekly chart of Duke Realty Corporation. |
| Graphic provided by: AdvancedGET. |
| |
| The weekly chart in Figure 1 shows how the share price fell from a high of $48.52 in February 2007 to a low of $4.20 by March 2009. The price has slowly started recovering in an Elliott Wave count that does not follow the first rule of Elliott Wave analysis, which is the chart must look correct. This is because wave 4 of Wave I is below the high of wave 1 of Wave I, but for the moment we will accept it, knowing that a new count is possibly a little way down the road. Of course, although on the chart the rise in price from $4.20 to $18.97 does look flat, this is because of the collapse of the share price. Do note that the RSI indicator shown on the chart is still weak, suggesting further weakness ahead. The daily chart in Figure 2 gives a different picture. |

|
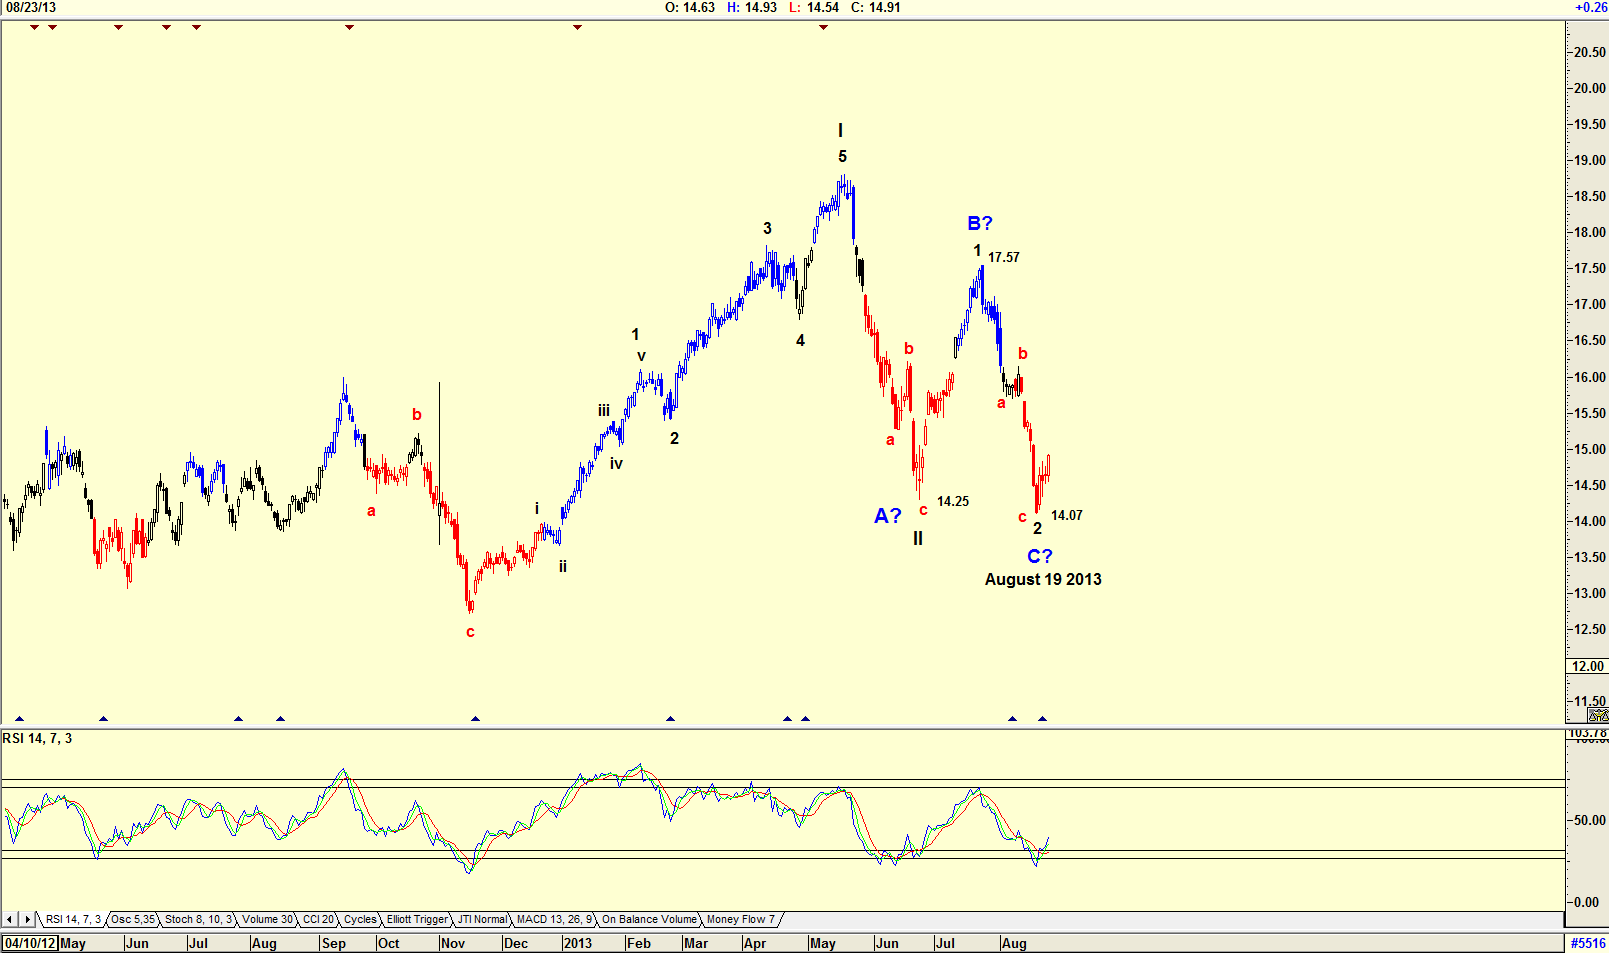
| Figure 2. Daily chart of Duke Realty Corporation. |
| Graphic provided by: AdvancedGET. |
| |
| The daily chart in Figure 2 shows an Elliott Wave count suggesting that a Wave 2 of WAVE III is complete. Here the fall of Wave 2 of WAVE III is greater than the rise of Wave 1 of WAVE III suggesting an alternate wave count shown in blue. This count looks probable and suggests that you should consider both accounts a possibility as the share price progresses. With the price currently at $14.91 and with the RSI suggesting a buy, the share could be bought. However, I suggest placing close stops because of the uncertainty in the Elliott wave count. With the uncertainty in the Elliott Wave count; with the expected rise in interest rates; with the uncertainty in the future of Fannie Mae and Freddie Mac; and finally with Ben Bernanke leaving office in January 2014, you have to question the future of the US economy and the property market. The RSI indicator is suggesting a buy of DRE, and I will be a buyer, but I will also keep my stops close. |
Has been a technical analyst since 1969, and has worked as a futures and options trader with First Financial Futures in Johannesburg, South Africa.
| Address: | 3256 West 24th Ave |
| Vancouver, BC | |
| Phone # for sales: | 6042634214 |
| E-mail address: | petroosp@gmail.com |
Click here for more information about our publications!
PRINT THIS ARTICLE

Request Information From Our Sponsors
- StockCharts.com, Inc.
- Candle Patterns
- Candlestick Charting Explained
- Intermarket Technical Analysis
- John Murphy on Chart Analysis
- John Murphy's Chart Pattern Recognition
- John Murphy's Market Message
- MurphyExplainsMarketAnalysis-Intermarket Analysis
- MurphyExplainsMarketAnalysis-Visual Analysis
- StockCharts.com
- Technical Analysis of the Financial Markets
- The Visual Investor
- VectorVest, Inc.
- Executive Premier Workshop
- One-Day Options Course
- OptionsPro
- Retirement Income Workshop
- Sure-Fire Trading Systems (VectorVest, Inc.)
- Trading as a Business Workshop
- VectorVest 7 EOD
- VectorVest 7 RealTime/IntraDay
- VectorVest AutoTester
- VectorVest Educational Services
- VectorVest OnLine
- VectorVest Options Analyzer
- VectorVest ProGraphics v6.0
- VectorVest ProTrader 7
- VectorVest RealTime Derby Tool
- VectorVest Simulator
- VectorVest Variator
- VectorVest Watchdog
