HOT TOPICS LIST
- MACD
- Fibonacci
- RSI
- Gann
- ADXR
- Stochastics
- Volume
- Triangles
- Futures
- Cycles
- Volatility
- ZIGZAG
- MESA
- Retracement
- Aroon
INDICATORS LIST
LIST OF TOPICS
PRINT THIS ARTICLE
by Koos van der Merwe
Last week it was announced that Yahoo! had more hits than Google.
Position: Sell
Koos van der Merwe
Has been a technical analyst since 1969, and has worked as a futures and options trader with First Financial Futures in Johannesburg, South Africa.
PRINT THIS ARTICLE
ELLIOTT WAVE
What Is Googling At Google?
08/27/13 04:06:56 PMby Koos van der Merwe
Last week it was announced that Yahoo! had more hits than Google.
Position: Sell
| I use Google Chrome. I use Gmail. Lately however, when I have tried to access my trading account I have received a security message saying that the site's security certificate has expired. "Important Notice for Google Chrome users You will experience difficulty accessing Online Banking if you are using the latest version (version 29) of Google Chrome. We are aware of this issue and are working to resolve it as quickly as possible. In the interim, please use another browser supported by Online Banking; Internet Explorer, Firefox or Safari." WHY? Has Google's success gone to its head, or is it rewriting Google Chrome to provide greater internet security? Looking at charts may give us an answer. |

|
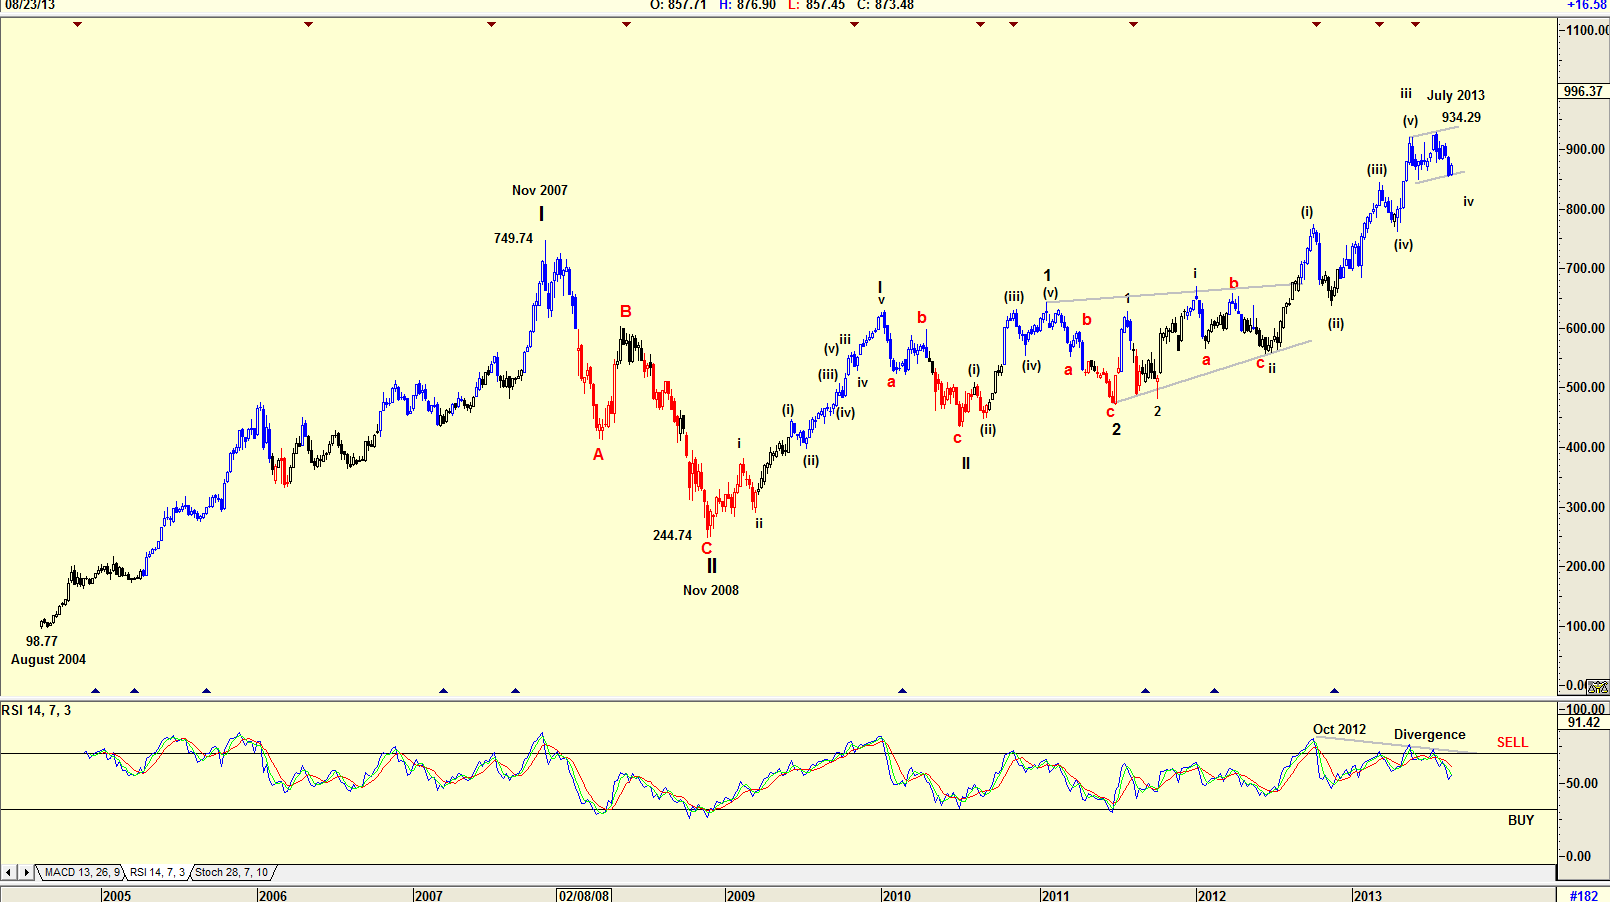
| Figure 1. Weekly Chart of Google. |
| Graphic provided by: AdvancedGET. |
| |
| The weekly chart in Figure 1 of Google, Inc. (GOOG) shows how the price rose from $98.77 in August 2004 to $749.74 by November 2007. Along with the mortgage-backed security bubble that burst, the price fell to $244.74 by November 2008. Then, in what has turned out to be a complicated Elliott Wave count, the price rose to its present price of $934.29. Never forgetting that an Elliott wave count is never cast in stone, but acts as a sign post that can change direction a little way down the road, you can consider the RSI indicator to help with that signpost. Note that the RSI indicator has given a divergence sell signal which means that the price should fall in a wave iv of a Wave 3 of a Wave III. Of a WAVE III. Extremely complicated or what? This very complicated wave count is what puts doubt into any trader's mind as to Google's future success as a leader in its field. |

|
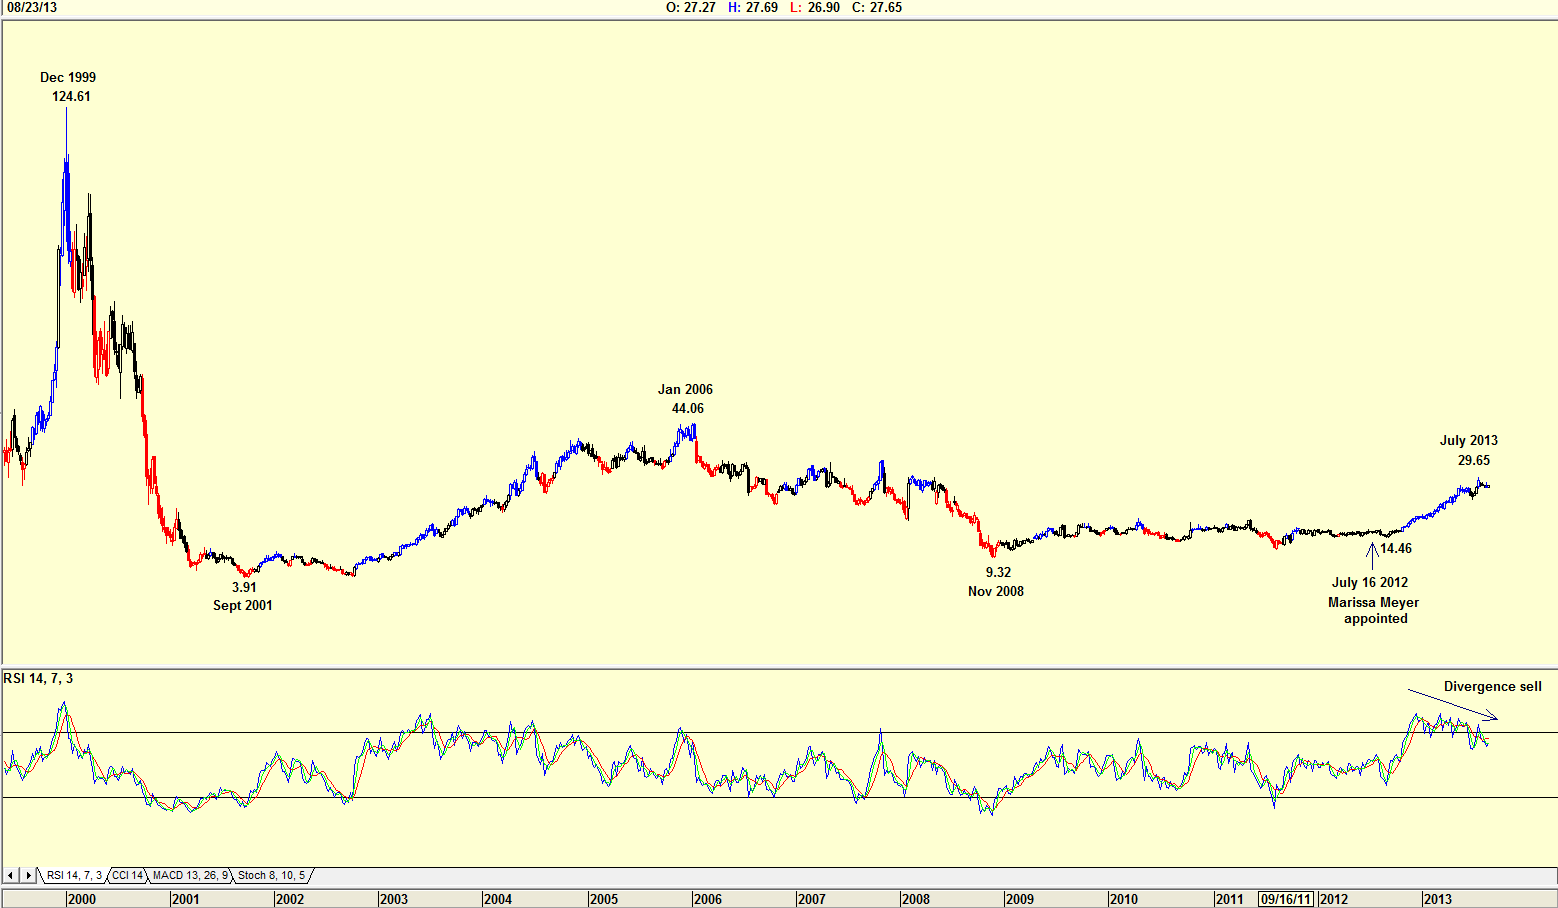
| Figure 2. Weekly Chart of Yahoo. |
| Graphic provided by: AdvancedGET. |
| |
| The chart in Figure 2 is a weekly chart of Yahoo, Inc. (YHOO), which shows how the price fell from a high of $124.61 in December 1999 ahead of the technology bubble that burst in 2000, to a low of $3.91 by September 2001. The share price rose to $44.06 by January 2006 along with the market's recovery, but fell to $9.32 by November 2008. From that date the share price moved sideways, with little enthusiasm. Then, on July 16, 2012, Marissa Meyer was appointed President and CEO of Yahoo. Marissa was one of the Google originals, joining the company in 1999 as employee #20, the company's first female engineer. Over the years she was engineer, designer, product manager, and executive with key roles in Google's development. In February 2013, she oversaw a major personnel policy change at Yahoo. On May 20, 2013, Yahoo acquired Tumblr. In July 2013 Yahoo reported a fall in revenues, but a rise in profits compared to the same period the previous year. Yes the share price fell, but as investors followed Warren Buffett's policy of "look to the management," the fall in price was negligible. The RSI indicator is suggesting a divergence sell signal, but placing faith with Marissa, we could see a similar pattern develop with the RSI as we saw in 2003-2006. |

|
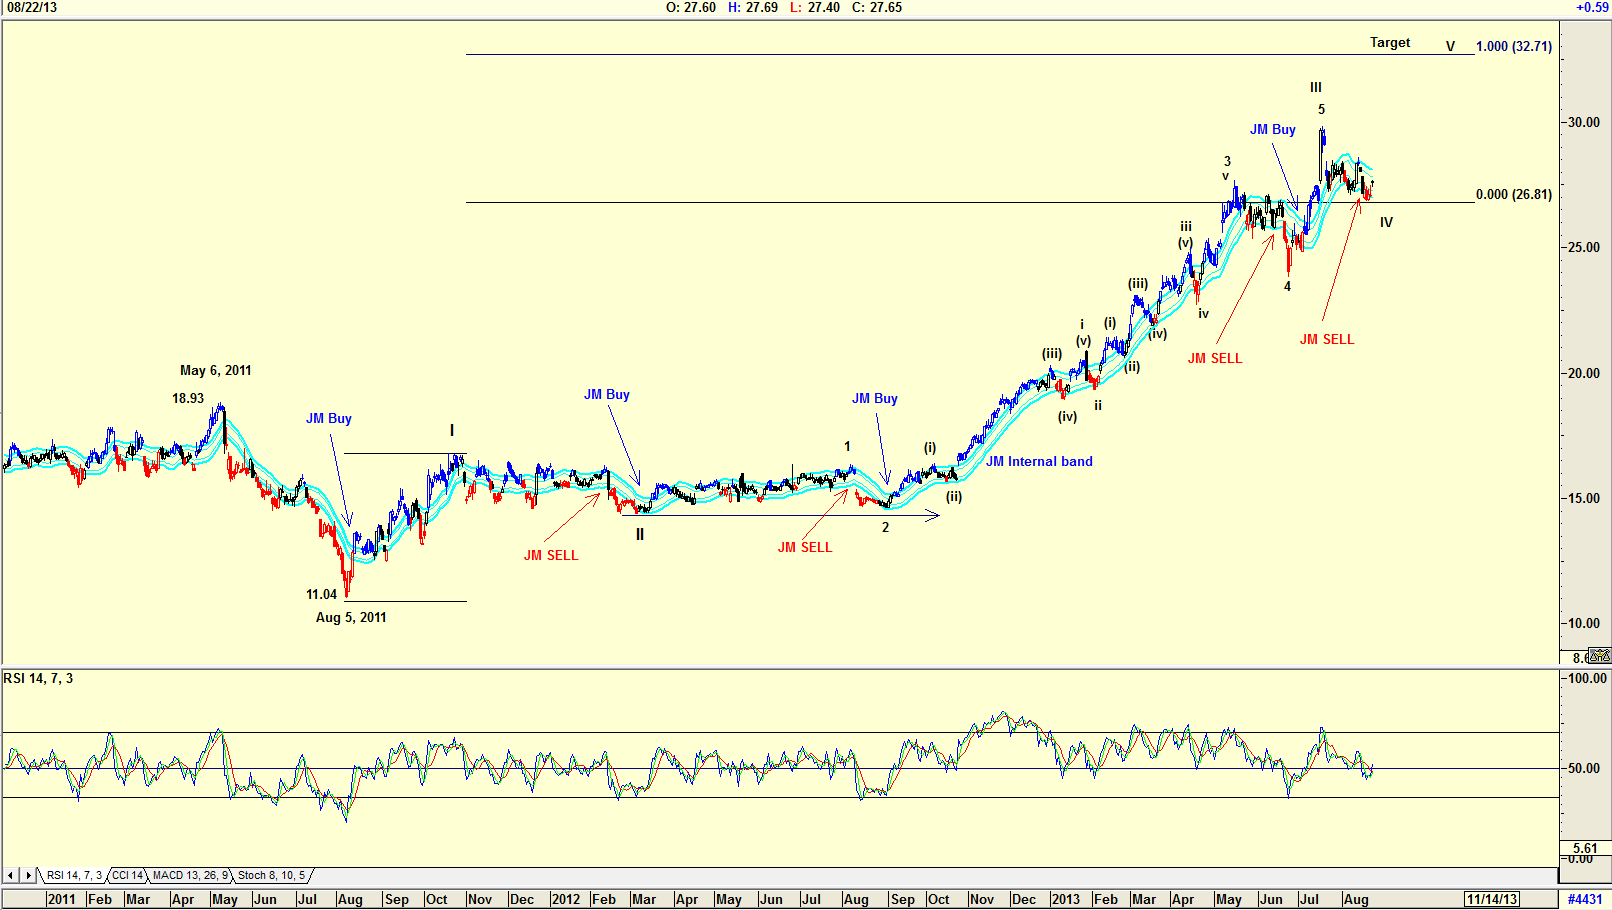
| Figure 3. Daily chart of Yahoo. |
| Graphic provided by: AdvancedGET. |
| |
| The chart in Figure 3 is a daily chart with an Elliott Wave count suggesting that the target for WAVE V could be $32.71. With the RSI still showing weakness, but with previous history showing that buy signals were given when the index touched the 50 level, the probability of a rise looks very real. Note that the share price has given a sell signal with the JM Internal band indicator. The JM Internal band is a 15-period simple moving average offset by 2% positive and 2% negative. A buy signal is given when the closing price breaks above the upper band, and a sell signal is given when it breaks below the lower band. After the announcement on August 22, 2013 that more people hit Yahoo than Google, you have to wonder about Google's future success. I would be more inclined to be a seller of GOOG at current prices, but I would not be a buyer of YHOO, yet. I would wait for a buy signal; as the price breaks above the upper JM internal band. With Marissa Meyer Yahooing Google, I would feel comfortable placing my bet with her. |
Has been a technical analyst since 1969, and has worked as a futures and options trader with First Financial Futures in Johannesburg, South Africa.
| Address: | 3256 West 24th Ave |
| Vancouver, BC | |
| Phone # for sales: | 6042634214 |
| E-mail address: | petroosp@gmail.com |
Click here for more information about our publications!
Comments

Request Information From Our Sponsors
- StockCharts.com, Inc.
- Candle Patterns
- Candlestick Charting Explained
- Intermarket Technical Analysis
- John Murphy on Chart Analysis
- John Murphy's Chart Pattern Recognition
- John Murphy's Market Message
- MurphyExplainsMarketAnalysis-Intermarket Analysis
- MurphyExplainsMarketAnalysis-Visual Analysis
- StockCharts.com
- Technical Analysis of the Financial Markets
- The Visual Investor
- VectorVest, Inc.
- Executive Premier Workshop
- One-Day Options Course
- OptionsPro
- Retirement Income Workshop
- Sure-Fire Trading Systems (VectorVest, Inc.)
- Trading as a Business Workshop
- VectorVest 7 EOD
- VectorVest 7 RealTime/IntraDay
- VectorVest AutoTester
- VectorVest Educational Services
- VectorVest OnLine
- VectorVest Options Analyzer
- VectorVest ProGraphics v6.0
- VectorVest ProTrader 7
- VectorVest RealTime Derby Tool
- VectorVest Simulator
- VectorVest Variator
- VectorVest Watchdog
