

HOT TOPICS LIST
- MACD
- Fibonacci
- RSI
- Gann
- ADXR
- Stochastics
- Volume
- Triangles
- Futures
- Cycles
- Volatility
- ZIGZAG
- MESA
- Retracement
- Aroon
INDICATORS LIST
LIST OF TOPICS
PRINT THIS ARTICLE
by Donald W. Pendergast, Jr.
Down by 10% during the past month, shares of ExxonMobil are getting close to a key support zone.
Position: N/A
Donald W. Pendergast, Jr.
Freelance financial markets writer and online publisher of the Trendzetterz.com S&P 500 Weekly Forecast service.
PRINT THIS ARTICLE
RSI
ExxonMobil: Is The Selling Overdone?
08/26/13 04:49:55 PMby Donald W. Pendergast, Jr.
Down by 10% during the past month, shares of ExxonMobil are getting close to a key support zone.
Position: N/A
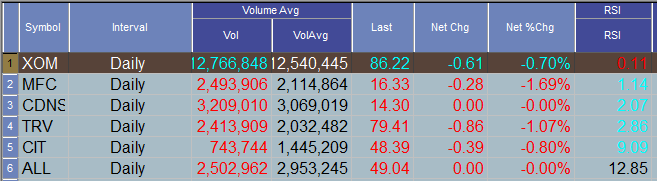
| The volatility of most of the giant, integrated oil/gas production companies is, generally speaking, less than those stocks in the oil services industry; for example, Exxon Mobil (XOM), and Baker Hughes (BHI) have radically different betas when measured against the daily volatility of the S&P 500 index (.SPX); XOM's beta is. .52 and BHI's comes in at a whopping 1.56. Simply put, BHI is about 56% more volatile then the .SPX and XOM is about 48% less volatile than .SPX. For swing traders, a big beta stock is to be preferred rather than a small beta one, all else being equal; the big idea, of course is that a high beta stock has more potential "energy" (pardon pun) with which to initiate and then maintain a tradable swing move, higher or lower. Why then are we going to consider XOM as a trading candidate here, then? Read on to learn why XOM may still be a great long swing candidate, low beta or not. |
|
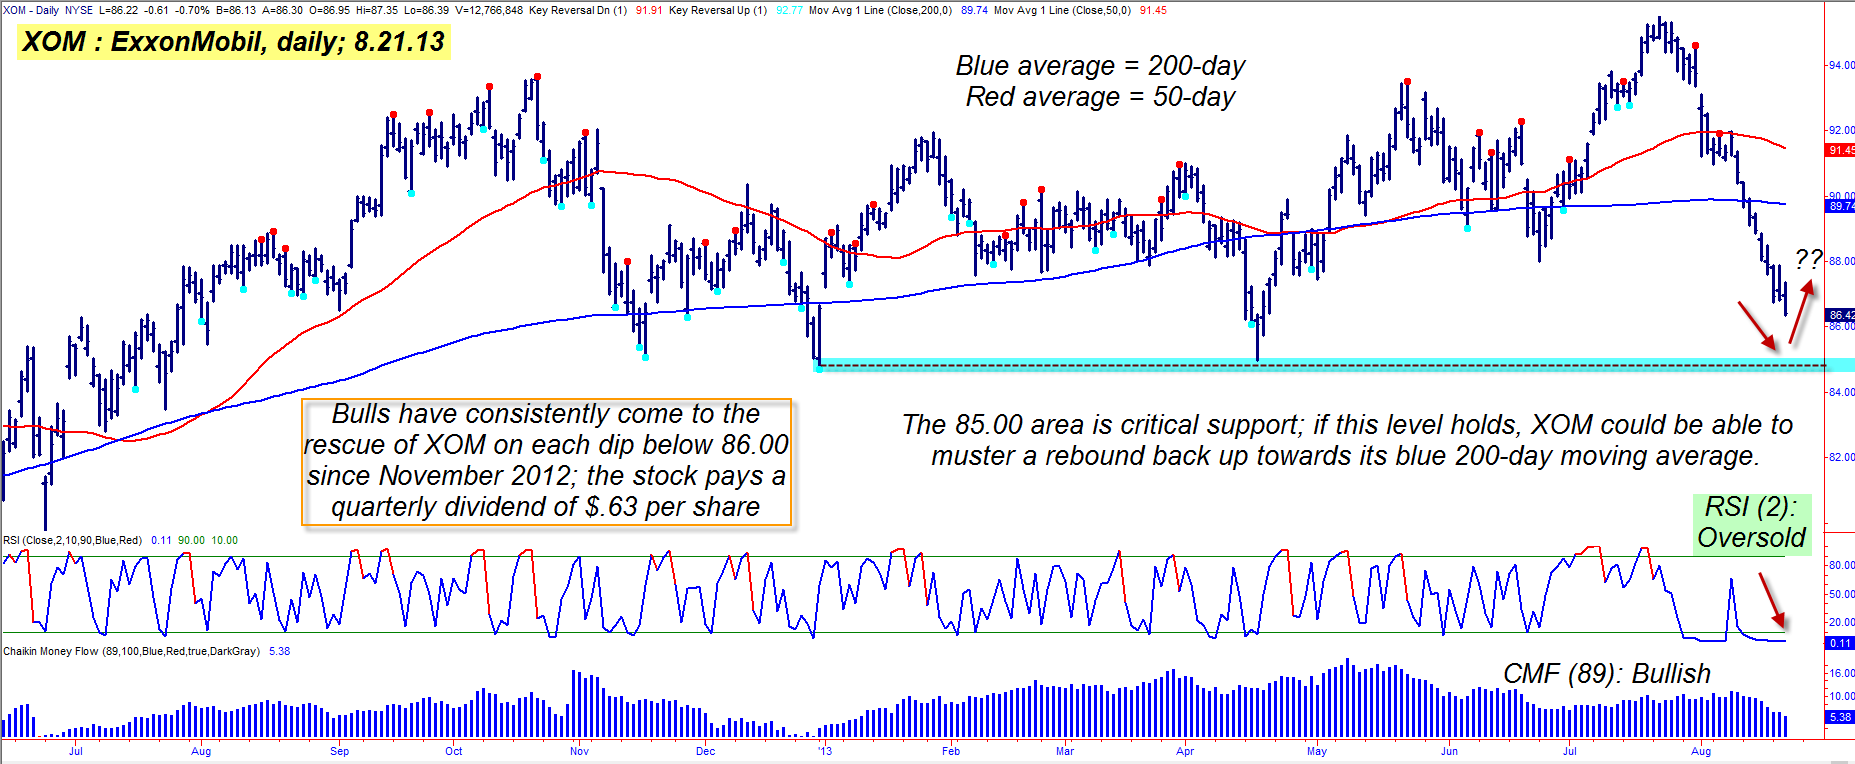
| Figure 1. With such strong demand repeatedly showing up between 85.00/86.00, it appears that the "smart money" may be just itching to get another shot at buying ExxonMobil (XOM) in the near future. |
| Graphic provided by: TradeStation. |
| |
| If you've been a reader of my TCA articles for any length of time, then you know that the concept of support and resistance is perhaps the single most important technical charting dynamic to pay attention to. In the daily chart of XOM in Figure 1, look at how obviously central the major support line at 85.00 is to the entire interpretation of its price action; anytime you see a stock rally sharply after hitting the same support level, you know that is where the "smart money" will typically step in and buy even as the small-fry trader/investor is bailing out and running for cover. XOM is now just a few pennies above that same major demand area of 85.00/86.00 and still has solid technical and fundamentals in place that make it a great long swing trade or short put play: 1. The long-term money flow (based on the Chaikin Money flow histogram [CMF][89]) is amazingly strong — well above its zero line — and this is a strong clue that the "smart money" is not selling out in fear but has been using this selloff to accumulate more shares on the cheap. 2. The major US stock indexes simply refuse to go into a bear market, despite several fake-out moves since June 2013. Second quarter earnings haven't been stellar, but they're certainly not in the cell, either. Until the .SPX, .NDX and .RUT start to decline in a meaningful way, the smartest way to play the market is to trade the ranges on big-cap, dividend-paying stocks like XOM. 3. Look at the 2-day RSI — it's down near a reading of .11, which is nearly as low as it can mathematically decline. Once you see a confirmed bullish reversal bar (printing above the support line), any break above that bar's high should bring the bulls back out in force, causing the shorts to cover quickly and driving XOM back higher, perhaps toward its 200-day moving average — currently near 89.74. |
|
| Figure 2. XOM's 2-day RSI is at one of the lowest possible levels mathematically achievable — it's at a miniscule reading of only .11. |
| Graphic provided by: TradeStation. |
| Graphic provided by: TradeStation Radar Screen. |
| |
| Perhaps the least-hassle way to play an anticipated bounce in XOM is to sell the October '13 XOM $82.50 put option; with this put you get about a $2.50 price cushion between the 85.00 support level and the option strike price, a very good bid-ask spread and an open interest figure of 4,552 contracts. Again, once XOM puts in a confirmed reversal bar and then starts breaking above it, that's the time to sell this put. If the stock hits 89.00 or if the put loses 50 to 60% of its value, buy it back as quickly as you can for a profit; if XOM stumbles instead, buy the put back if XOM breaks below 85.00 or if the put increases in value by 80 to 90%, whichever comes first. As this is a reversal-style trade, try to keep you max account risk as close to 1% as possible. As always, trade wisely until we meet here again. |
Freelance financial markets writer and online publisher of the Trendzetterz.com S&P 500 Weekly Forecast service.
| Title: | Market consultant and writer |
| Company: | Trendzetterz |
| Address: | 81 Hickory Hollow Drive |
| Crossville, TN 38555 | |
| Phone # for sales: | 904-303-4814 |
| Website: | trendzetterz.com |
| E-mail address: | support@trendzetterz.com |
Traders' Resource Links | |
| Trendzetterz has not added any product or service information to TRADERS' RESOURCE. | |
Click here for more information about our publications!
Comments

Request Information From Our Sponsors
- StockCharts.com, Inc.
- Candle Patterns
- Candlestick Charting Explained
- Intermarket Technical Analysis
- John Murphy on Chart Analysis
- John Murphy's Chart Pattern Recognition
- John Murphy's Market Message
- MurphyExplainsMarketAnalysis-Intermarket Analysis
- MurphyExplainsMarketAnalysis-Visual Analysis
- StockCharts.com
- Technical Analysis of the Financial Markets
- The Visual Investor
- VectorVest, Inc.
- Executive Premier Workshop
- One-Day Options Course
- OptionsPro
- Retirement Income Workshop
- Sure-Fire Trading Systems (VectorVest, Inc.)
- Trading as a Business Workshop
- VectorVest 7 EOD
- VectorVest 7 RealTime/IntraDay
- VectorVest AutoTester
- VectorVest Educational Services
- VectorVest OnLine
- VectorVest Options Analyzer
- VectorVest ProGraphics v6.0
- VectorVest ProTrader 7
- VectorVest RealTime Derby Tool
- VectorVest Simulator
- VectorVest Variator
- VectorVest Watchdog