

HOT TOPICS LIST
- MACD
- Fibonacci
- RSI
- Gann
- ADXR
- Stochastics
- Volume
- Triangles
- Futures
- Cycles
- Volatility
- ZIGZAG
- MESA
- Retracement
- Aroon
INDICATORS LIST
LIST OF TOPICS
PRINT THIS ARTICLE
by Chaitali Mohile
The volatile rally of TransMontaigne Partners LP has found a resting point.
Position: N/A
Chaitali Mohile
Active trader in the Indian stock markets since 2003 and a full-time writer. Trading is largely based upon technical analysis.
PRINT THIS ARTICLE
SUPPORT & RESISTANCE
TLP At Tricky Support-Resistance
08/27/13 03:49:35 PMby Chaitali Mohile
The volatile rally of TransMontaigne Partners LP has found a resting point.
Position: N/A
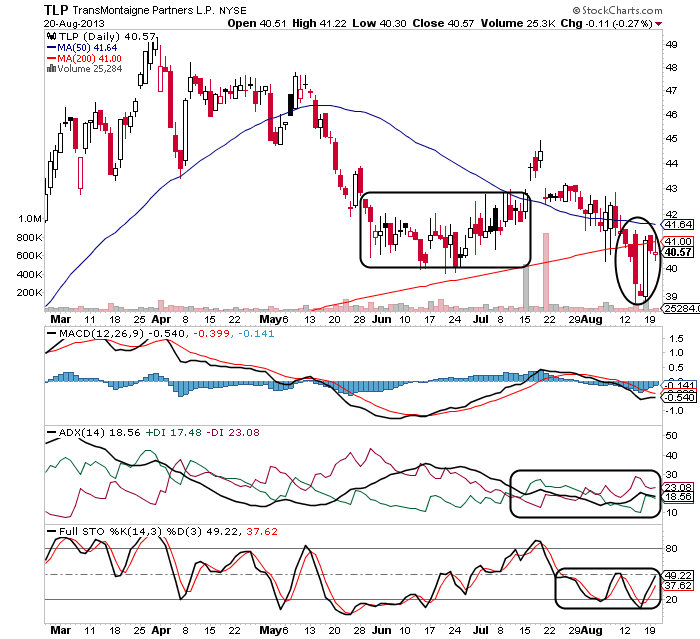
| In the last few months TransMontaigne Partners LP (TLP) has witnessed tremendous volatility. None of the previous rallies followed a particular direction. There were many large bearish candlesticks with upper and lower shadows. The stock breached the 50-day moving average (MA) support and retraced toward the 200-day moving average (MA) support. Here, TLP established strong support, forming a rounded bottom (bullish reversal formation). |
| In Figure 1, the pattern broke upwards by violating the 50-day MA resistance in mid-July. Though the breakout occurred with a small gap up, it failed to sustain above the newly formed MA support. However, the gap between the descending 50-day MA and ascending 200-day MA has shrunk. TLP has the immediate support of the long-term MA. These shaky and unstable price actions show huge volatility and the existence of bearish pressure in TLP. |
|
| FIGURE 1: TLP, DAILY. |
| Graphic provided by: StockCharts.com. |
| |
| Eventually, TLP plunged below the 200-day MA support, triggering fresh selling pressure. The stock is struggling near its freshly formed MA resistance. However, a developing downtrend indicated by the average directional index (ADX)(14) and the ranging stochastic oscillator (14,3,3) are likely to add bearish pressure on the stock. In addition, the descending moving average convergence/divergence (MACD)(12,26,9) is suggesting negative momentum in the rally. Thus, Figure 1 shows that TLP would remain weak in the short-term. |
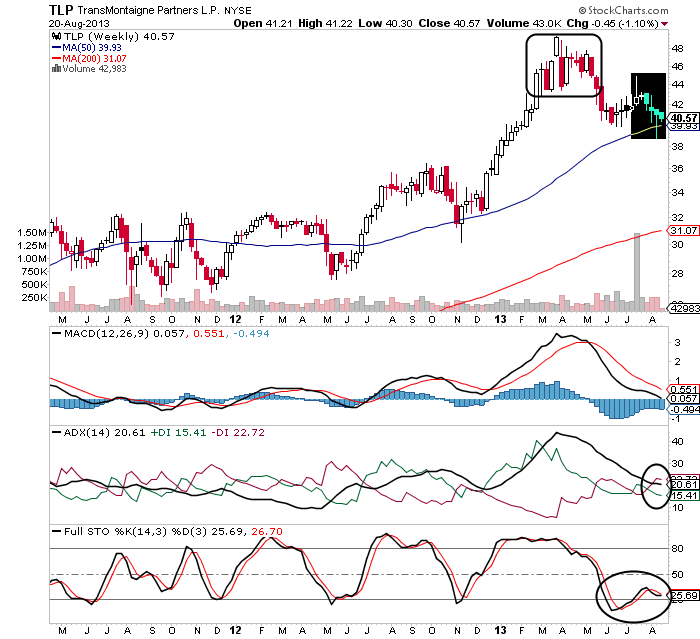
| On the weekly chart in Figure 2, TLP formed a top at the $48 level. The stock consolidated at the new high for about three to four months. All the three highly bullish indicators in Figure 2 initiated a bearish breakout from the new high. After this downward breakout, the stock rushed to establish support at the 50-day MA. There is a cluster of doji candlestick formations, suggesting uncertainty in the direction of the rally. Although the price rally tried to surge with the moving average support, a shooting star candlestick followed by the series of bearish candlesticks reversed the price action. |
|
| FIGURE 2: TLP, WEEKLY. |
| Graphic provided by: StockCharts.com. |
| |
| In the meantime, the MACD (12,26,9) turned negative after undergoing a bearish crossover in Figure 2. The momentum oscillator has reached the zero line; further decline would boost selling pressure. An overheated uptrend has reversed, developing a fresh downtrend. An oversold full stochastic (14,3,3) is likely to drift below 20 levels. Currently, all indicators are proceeding toward their respective bearish zones. Therefore, TLP is likely to struggle to sustain above the 50-day MA support. This support is the only bullish hope for the stock to protect its positive sentiments. However, if the developing downtrend turns stronger, the stock will be forced to shift below the 50-day MA support. Hence, a breakout of this tricky support-resistance zone will decide the future direction of TLP. |
Active trader in the Indian stock markets since 2003 and a full-time writer. Trading is largely based upon technical analysis.
| Company: | Independent |
| Address: | C1/3 Parth Indraprasth Towers. Vastrapur |
| Ahmedabad, Guj 380015 | |
| E-mail address: | chaitalimohile@yahoo.co.in |
Traders' Resource Links | |
| Independent has not added any product or service information to TRADERS' RESOURCE. | |
Click here for more information about our publications!
PRINT THIS ARTICLE

Request Information From Our Sponsors
- StockCharts.com, Inc.
- Candle Patterns
- Candlestick Charting Explained
- Intermarket Technical Analysis
- John Murphy on Chart Analysis
- John Murphy's Chart Pattern Recognition
- John Murphy's Market Message
- MurphyExplainsMarketAnalysis-Intermarket Analysis
- MurphyExplainsMarketAnalysis-Visual Analysis
- StockCharts.com
- Technical Analysis of the Financial Markets
- The Visual Investor
- VectorVest, Inc.
- Executive Premier Workshop
- One-Day Options Course
- OptionsPro
- Retirement Income Workshop
- Sure-Fire Trading Systems (VectorVest, Inc.)
- Trading as a Business Workshop
- VectorVest 7 EOD
- VectorVest 7 RealTime/IntraDay
- VectorVest AutoTester
- VectorVest Educational Services
- VectorVest OnLine
- VectorVest Options Analyzer
- VectorVest ProGraphics v6.0
- VectorVest ProTrader 7
- VectorVest RealTime Derby Tool
- VectorVest Simulator
- VectorVest Variator
- VectorVest Watchdog