

HOT TOPICS LIST
- MACD
- Fibonacci
- RSI
- Gann
- ADXR
- Stochastics
- Volume
- Triangles
- Futures
- Cycles
- Volatility
- ZIGZAG
- MESA
- Retracement
- Aroon
INDICATORS LIST
LIST OF TOPICS
PRINT THIS ARTICLE
by Donald W. Pendergast, Jr.
Shares of Chevron Corp. have been trending lower for the past four weeks. Will its 200-day moving average once again act as major support?
Position: N/A
Donald W. Pendergast, Jr.
Freelance financial markets writer and online publisher of the Trendzetterz.com S&P 500 Weekly Forecast service.
PRINT THIS ARTICLE
RSI
Chevron: Nearing A Major Turn?
08/23/13 12:20:46 PMby Donald W. Pendergast, Jr.
Shares of Chevron Corp. have been trending lower for the past four weeks. Will its 200-day moving average once again act as major support?
Position: N/A
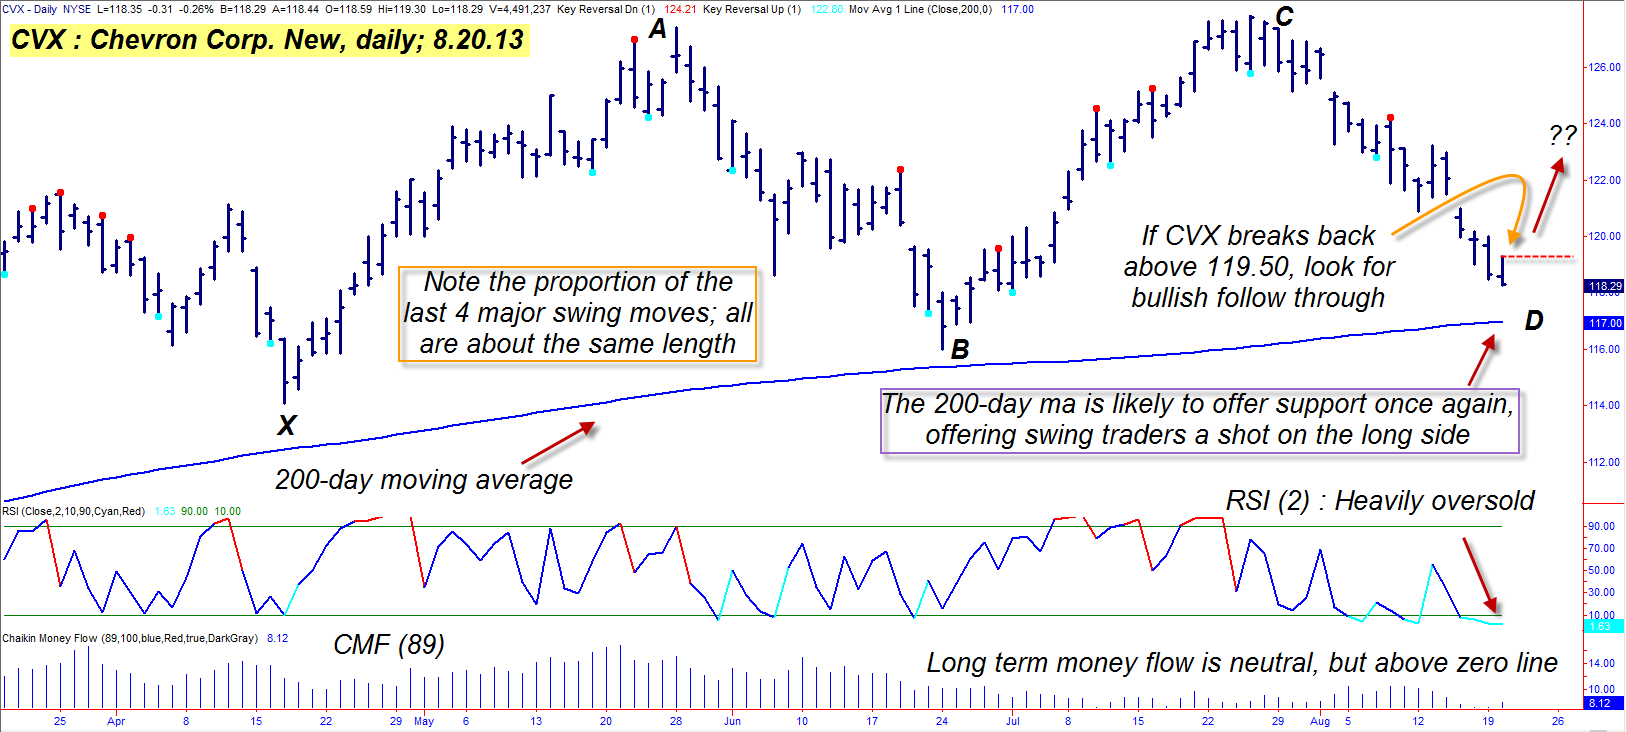
| Among all of the large cap, integrated oil producer stocks, shares of Chevron Corp. (CVX) tend to make tradable swing moves — the kind that both stock and option traders alike can truly appreciate. Right now, CVX is closing in on a major support area at a time when numerous technical dynamics are all suggesting that a bullish bounce is due very soon. Here's a closer look at CVX's daily chart dynamics (Figure 1). |
|
| Figure 1. Will this third descent toward its 200-day moving average launch yet another rally in CVX? |
| Graphic provided by: TradeStation. |
| |
| As you gaze at CVX's daily graph, perhaps the most striking feature of all would have to be the nearly symmetrical swing moves that have printed since mid-April 2013. All of the swings are between $10 and $12 in length, with the origination point (X) and swing AB beginning or ending just above the blue 200-day moving average. More recently, swing CD is also close to the 200-day MA, getting ever closer to making a final cycle low (in this case a combination of the 10-, 20-, 40- and 80-day cycles). This cycle low is anticipated to bottom out just as these other key dynamics reveal the following bullish biases in CVX: 1. Long-term money flow (as evidenced by the 89-day Chaikin Money flow (CMF)(89) histogram) is still modestly bullish, as is the 34-day CMF. 2. The two-period RSI indicator is deeply oversold (with a miniscule reading of 1.63), also hinting at a fast approaching cycle low. 3. Swing CD is roughly the same length as the prior three swings, and with the 200-day MA just below the current price, odds are quite good that CVX will bottom and finally reverse higher with the next one to three trading sessions. During Tuesday's trading action, many deeply oversold stocks and etf's reversed higher, and the probabilities favor some more upside before the major stock indexes go on to take out Monday's lows. If the .SPX (S&P 500 index) is due to rally for another few sessions, it will most likely help drive the price higher in CVX, as well. The 52-week correlation between CVX and SPY is fairly close at .484, so this is definitely something to watch for. |
|
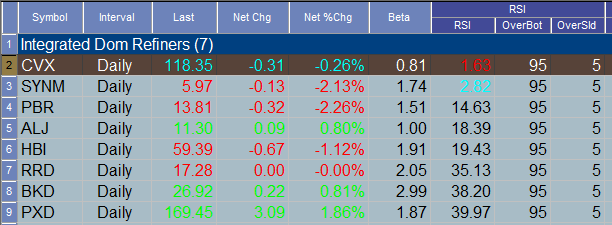
| Figure 2. Note how deeply oversold the 2-day RSI indicator is for both CVX and SYNM. Watch for bullish reversals in both stocks soon. |
| Graphic provided by: TradeStation. |
| Graphic provided by: TradeStation Radar Screen. |
| |
| Playing CVX on a bullish bounce is simple: 1. Look for a bullish reversal bar to print after the bar that ultimately makes the final low for swing CD appears. 2. Place a buy stop market order about ten cents above the high of the reversal bar. 3. If filled, immediately place a sell stop market order (good-til-cancelled or GTC) just below the 200-day MA and begin managing the trade with a three-bar trailing stop of the daily lows if price begins to rise. 5. If CVX makes it up as high as 123.23 during the anticipated rally, consider taking half profits and/or tightening the stop loss to a two-bar trail. Skilled put sellers might want to investigate selling the September '12 CVX $115.00 put option if CVX triggers a long swing trade (as detailed above); the bid-ask spread is excellent and the open interest is 4,430 contracts. If you go this route, take all profits if CVX hits $122.50 or if the price of the put increases by 80 to 90%. Since this is a reversal-style trade, be sure to limit your account risk to 1% max on this trade. As always, trade wisely until we meet again. |
Freelance financial markets writer and online publisher of the Trendzetterz.com S&P 500 Weekly Forecast service.
| Title: | Market consultant and writer |
| Company: | Trendzetterz |
| Address: | 81 Hickory Hollow Drive |
| Crossville, TN 38555 | |
| Phone # for sales: | 904-303-4814 |
| Website: | trendzetterz.com |
| E-mail address: | support@trendzetterz.com |
Traders' Resource Links | |
| Trendzetterz has not added any product or service information to TRADERS' RESOURCE. | |
Click here for more information about our publications!
Comments

Request Information From Our Sponsors
- StockCharts.com, Inc.
- Candle Patterns
- Candlestick Charting Explained
- Intermarket Technical Analysis
- John Murphy on Chart Analysis
- John Murphy's Chart Pattern Recognition
- John Murphy's Market Message
- MurphyExplainsMarketAnalysis-Intermarket Analysis
- MurphyExplainsMarketAnalysis-Visual Analysis
- StockCharts.com
- Technical Analysis of the Financial Markets
- The Visual Investor
- VectorVest, Inc.
- Executive Premier Workshop
- One-Day Options Course
- OptionsPro
- Retirement Income Workshop
- Sure-Fire Trading Systems (VectorVest, Inc.)
- Trading as a Business Workshop
- VectorVest 7 EOD
- VectorVest 7 RealTime/IntraDay
- VectorVest AutoTester
- VectorVest Educational Services
- VectorVest OnLine
- VectorVest Options Analyzer
- VectorVest ProGraphics v6.0
- VectorVest ProTrader 7
- VectorVest RealTime Derby Tool
- VectorVest Simulator
- VectorVest Variator
- VectorVest Watchdog