HOT TOPICS LIST
- MACD
- Fibonacci
- RSI
- Gann
- ADXR
- Stochastics
- Volume
- Triangles
- Futures
- Cycles
- Volatility
- ZIGZAG
- MESA
- Retracement
- Aroon
INDICATORS LIST
LIST OF TOPICS
PRINT THIS ARTICLE
by Donald W. Pendergast, Jr.
Still up by more than 170% since January 2012, shares of Hanesbrands, Inc. appear to be dropping toward a major support zone.
Position: N/A
Donald W. Pendergast, Jr.
Freelance financial markets writer and online publisher of the Trendzetterz.com S&P 500 Weekly Forecast service.
PRINT THIS ARTICLE
CYCLES
HBI: Descending Into A 40-Day Cycle Low?
08/21/13 03:09:46 PMby Donald W. Pendergast, Jr.
Still up by more than 170% since January 2012, shares of Hanesbrands, Inc. appear to be dropping toward a major support zone.
Position: N/A
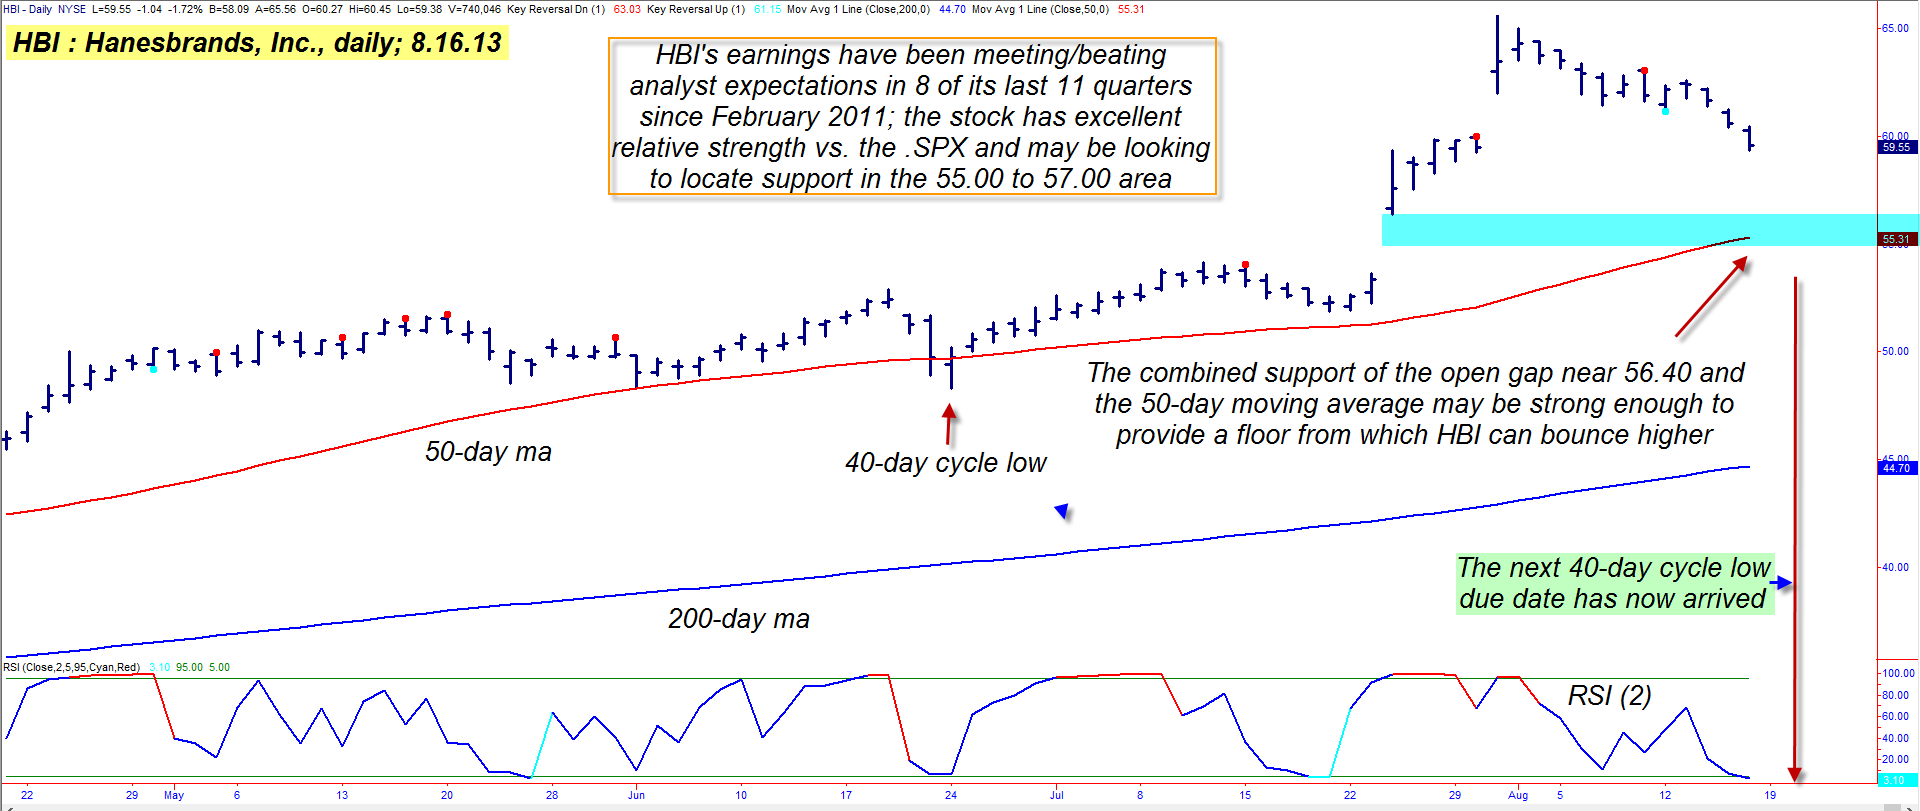
| The multicycle low seen back in December 2011 as Hanesbrands Inc. (HBI) was of a "major" variety, judging by the persistence of the stock's uptrend over the past twenty months; HBI recently peaked out north of the 65.00 area and has now pulled back below 60.00, getting ever closer to an anticipated time/price target zone (Figure 1). Is HBI a good "bounce" candidate or not? Here's a closer look at this stock's key technicals that are suggesting a bullish turn may be expected soon. |

|
| Figure 1. Shares of Hanesbrands Inc. (HBI) may be descending into the next 40-day cycle low; the reversal may occur prior to entering the blue shaded area, but if it occurs beneath it a larger correction will be unfolding. |
| Graphic provided by: TradeStation. |
| |
| Any time a stock can gain 170-plus percent in a little over a year and a half, you can bet that enterprising traders and patient investors will be looking for a low-risk entry point in the issue, hoping to catch yet another surge higher. And in the case of HBI, it appears that such market participants may soon be offered that opportunity. Here are the key dynamics that might just make it an attractive long pullback entry candidate: * HBI's 50- and 200-day moving averages are maintaining a wide spread and are still sloping higher. * HBI is outperforming the S&P 500 index (.SPX) by a wide margin across multiple time windows. * A 40-day cycle low is due within the next few trading sessions. * The two-day RSI has dipped into the ultra-oversold zone. * Major support for HBI resides in the 55.00 to 55.40 area, which coincides with the large open gap of late July 2013 and the stock's 50-day moving average (red line). *HBI has been regularly meeting/exceeding analyst earnings estimates since February 2011. Overall, that's a very bullish set of dynamics at work, and they combine to paint a picture of a fundamentally attractive, high momentum stock that is pulling back in a proportional correction within its long-term (and still intact) uptrend. In fact, there really is only one negative technical, and that's the slightly negative short- and long-term money flow trends; for long-term position traders this might be a deal killer, but for swing traders, this is not a major issue given the other bullish factors just detailed. |

|
| Figure 2. HBI has outperformed the .SPX by more than 56% over the past 12 months. Note the high beta (1.91) of the stock compared to the .SPX. |
| Graphic provided by: TradeStation. |
| Graphic provided by: TradeStation Radar Screen. |
| |
| Playing HBI as a long swing trade is very simple: 1. Wait for a bullish reversal bar and/or a bullish engulfing candle pattern to print. 2. Go long on a buy stop a little above the primary reversal bar in the pattern. 3. Set an initial stop just below the low of the reversal bar. 4. Begin running a three-bar trailing stop of the daily lows if the stock follows through and starts to rally. 5. If the stock manages to rally as high as 64.00, consider taking at least half profits, running the rest with a two-bar trail. Since this is a long entry in an existing uptrend, you may want to risk as much as (but not more than) 2% of your account equity on this trade; you should also make sure your stock portfolio is diversified among market sectors and that you're not overly long the market at this stage of the 4 1/2 year old bull market. Trade wisely until we meet here again. |
Freelance financial markets writer and online publisher of the Trendzetterz.com S&P 500 Weekly Forecast service.
| Title: | Market consultant and writer |
| Company: | Trendzetterz |
| Address: | 81 Hickory Hollow Drive |
| Crossville, TN 38555 | |
| Phone # for sales: | 904-303-4814 |
| Website: | trendzetterz.com |
| E-mail address: | support@trendzetterz.com |
Traders' Resource Links | |
| Trendzetterz has not added any product or service information to TRADERS' RESOURCE. | |
Click here for more information about our publications!
PRINT THIS ARTICLE

|

Request Information From Our Sponsors
- VectorVest, Inc.
- Executive Premier Workshop
- One-Day Options Course
- OptionsPro
- Retirement Income Workshop
- Sure-Fire Trading Systems (VectorVest, Inc.)
- Trading as a Business Workshop
- VectorVest 7 EOD
- VectorVest 7 RealTime/IntraDay
- VectorVest AutoTester
- VectorVest Educational Services
- VectorVest OnLine
- VectorVest Options Analyzer
- VectorVest ProGraphics v6.0
- VectorVest ProTrader 7
- VectorVest RealTime Derby Tool
- VectorVest Simulator
- VectorVest Variator
- VectorVest Watchdog
- StockCharts.com, Inc.
- Candle Patterns
- Candlestick Charting Explained
- Intermarket Technical Analysis
- John Murphy on Chart Analysis
- John Murphy's Chart Pattern Recognition
- John Murphy's Market Message
- MurphyExplainsMarketAnalysis-Intermarket Analysis
- MurphyExplainsMarketAnalysis-Visual Analysis
- StockCharts.com
- Technical Analysis of the Financial Markets
- The Visual Investor
