

HOT TOPICS LIST
- MACD
- Fibonacci
- RSI
- Gann
- ADXR
- Stochastics
- Volume
- Triangles
- Futures
- Cycles
- Volatility
- ZIGZAG
- MESA
- Retracement
- Aroon
INDICATORS LIST
LIST OF TOPICS
PRINT THIS ARTICLE
by Gary Grosschadl
This beer powerhouse may have gotten ahead of itself as several warning signs have emerged.
Position: N/A
Gary Grosschadl
Independent Canadian equities trader and technical analyst based in Peterborough
Ontario, Canada.
PRINT THIS ARTICLE
CHART ANALYSIS
Bud's Early Warning Signs
09/13/02 08:13:37 AMby Gary Grosschadl
This beer powerhouse may have gotten ahead of itself as several warning signs have emerged.
Position: N/A
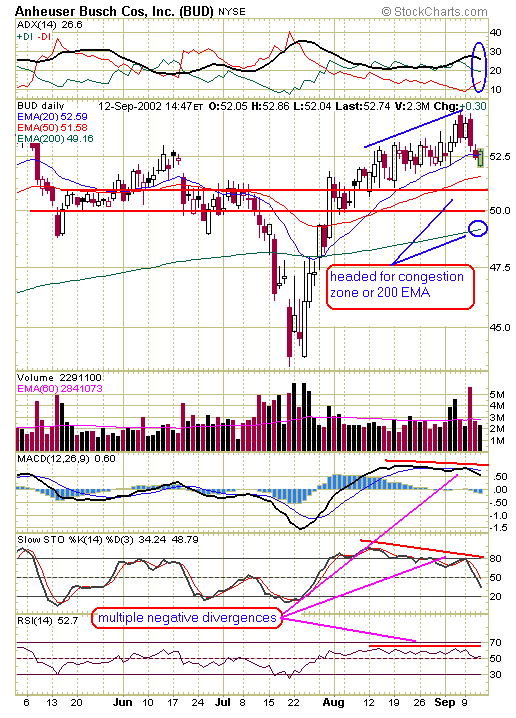
| The obvious recent warning signs are there for Anheuser Busch, Inc. (BUD) via two angry candlestick patterns. The first one occurred at the September 6, 2002 high when the stock made a move above the previous day's high only to close below the midpoint of the previous day. This is known as a dark cloud cover formation, a topping out warning sign. The next day's bullish candle did not close above the high of the previous day meaning that the dark cloud cover was still boss. The next day's bearish candle sealed BUD's short-term fate with another very bearish formation - a bearish engulfing pattern which "engulfed" the previous day's candle with a close below it. These two warnings in short order spoke loudly, making it clear that was no doubt to the next day's decline. |
| What may not be so obvious are the warning signs that came just prior to these ominous candle formations. Those who watch the displayed indicators would have noted several negative divergences were appearing. Note how new price highs were not confirmed with new highs on the indicators. That was a heads up to be alert for trouble brewing which was immediately confirmed with those warning candles that followed. |
|
| Graphic provided by: stockcharts.com. |
| |
| Two downside targets are possible - the previous congestion zone as outlined or the 200-day EMA. A more bullish scenario could have BUD bounce off closer support at the 50 EMA, around the 51.60 area. |
| The ADX (directional movement indicator) at the top of the chart shows the danger of a trend reversal from bullish to bearish should the DI lines actually cross. Failure of these lines to cross could coincide with a bounce off nearby support for an upward resumption. The test of lower support should give crucial clues to future direction -- will this be a minor correction or a more serious challenge? But with those multiple warnings from candles and divergences I am leaning towards the lower supports. |
Independent Canadian equities trader and technical analyst based in Peterborough
Ontario, Canada.
| Website: | www.whatsonsale.ca/financial.html |
| E-mail address: | gwg7@sympatico.ca |
Click here for more information about our publications!
Comments
Date:�09/17/02Rank:�5Comment:�
Date:�09/18/02Rank:�3Comment:�
Date:�09/18/02Rank:�5Comment:�

Request Information From Our Sponsors
- StockCharts.com, Inc.
- Candle Patterns
- Candlestick Charting Explained
- Intermarket Technical Analysis
- John Murphy on Chart Analysis
- John Murphy's Chart Pattern Recognition
- John Murphy's Market Message
- MurphyExplainsMarketAnalysis-Intermarket Analysis
- MurphyExplainsMarketAnalysis-Visual Analysis
- StockCharts.com
- Technical Analysis of the Financial Markets
- The Visual Investor
- VectorVest, Inc.
- Executive Premier Workshop
- One-Day Options Course
- OptionsPro
- Retirement Income Workshop
- Sure-Fire Trading Systems (VectorVest, Inc.)
- Trading as a Business Workshop
- VectorVest 7 EOD
- VectorVest 7 RealTime/IntraDay
- VectorVest AutoTester
- VectorVest Educational Services
- VectorVest OnLine
- VectorVest Options Analyzer
- VectorVest ProGraphics v6.0
- VectorVest ProTrader 7
- VectorVest RealTime Derby Tool
- VectorVest Simulator
- VectorVest Variator
- VectorVest Watchdog