

HOT TOPICS LIST
- MACD
- Fibonacci
- RSI
- Gann
- ADXR
- Stochastics
- Volume
- Triangles
- Futures
- Cycles
- Volatility
- ZIGZAG
- MESA
- Retracement
- Aroon
INDICATORS LIST
LIST OF TOPICS
PRINT THIS ARTICLE
by Koos van der Merwe
The "sell in May" correction could be in its final stages, but September is around the corner.
Position: Sell
Koos van der Merwe
Has been a technical analyst since 1969, and has worked as a futures and options trader with First Financial Futures in Johannesburg, South Africa.
PRINT THIS ARTICLE
ELLIOTT WAVE
How Much Lower?
08/20/13 04:34:39 PMby Koos van der Merwe
The "sell in May" correction could be in its final stages, but September is around the corner.
Position: Sell
| September is known to be the quietest trading month of the year. In the United States, Labor Day is always celebrated on the first Monday in September. This year that will be September 2, 2013. Holiday makers return from their holidays with families, and analysts start examining the market, looking for stocks to invest in. Is that truly so? What other reason is there for September to be the quietest month in any year, with October notorious for its dramatic crashes. With computers becoming more prevalent in the market, especially as far as trading is concerned, do these previous cyclical normalities still apply? |
|
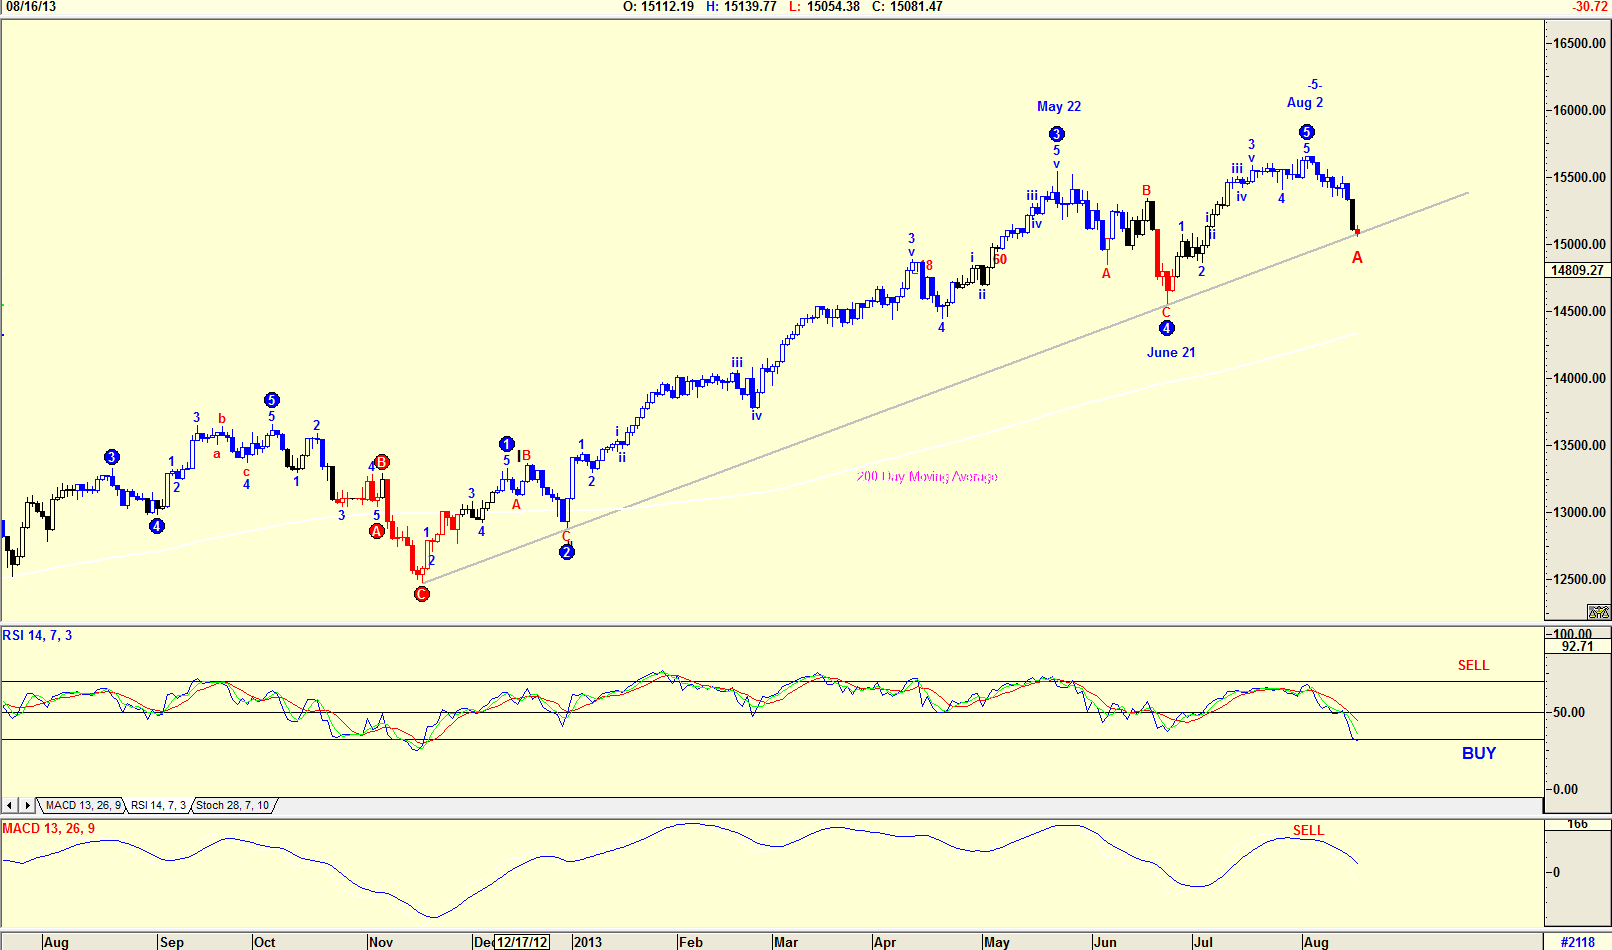
| Figure 1. Dow Jones Daily, with Elliott Wave count. |
| Graphic provided by: AdvancedGET. |
| |
| The daily chart of the Dow Jones in Figure 1 shows an Elliott Wave count. The Advanced GET program suggests that the index is in an ABC correction. The chart shows the Dow testing the long-term support line. This suggests that the Dow could correct upwards in a WAVE B before falling to retest and break through the support line in a WAVE C, possibly taking one into September. The RSI indicator shown is in overbought territory, but only barely. The MACD indicator is still negative. The Dow is also some distance from its 200-day moving average. |
|
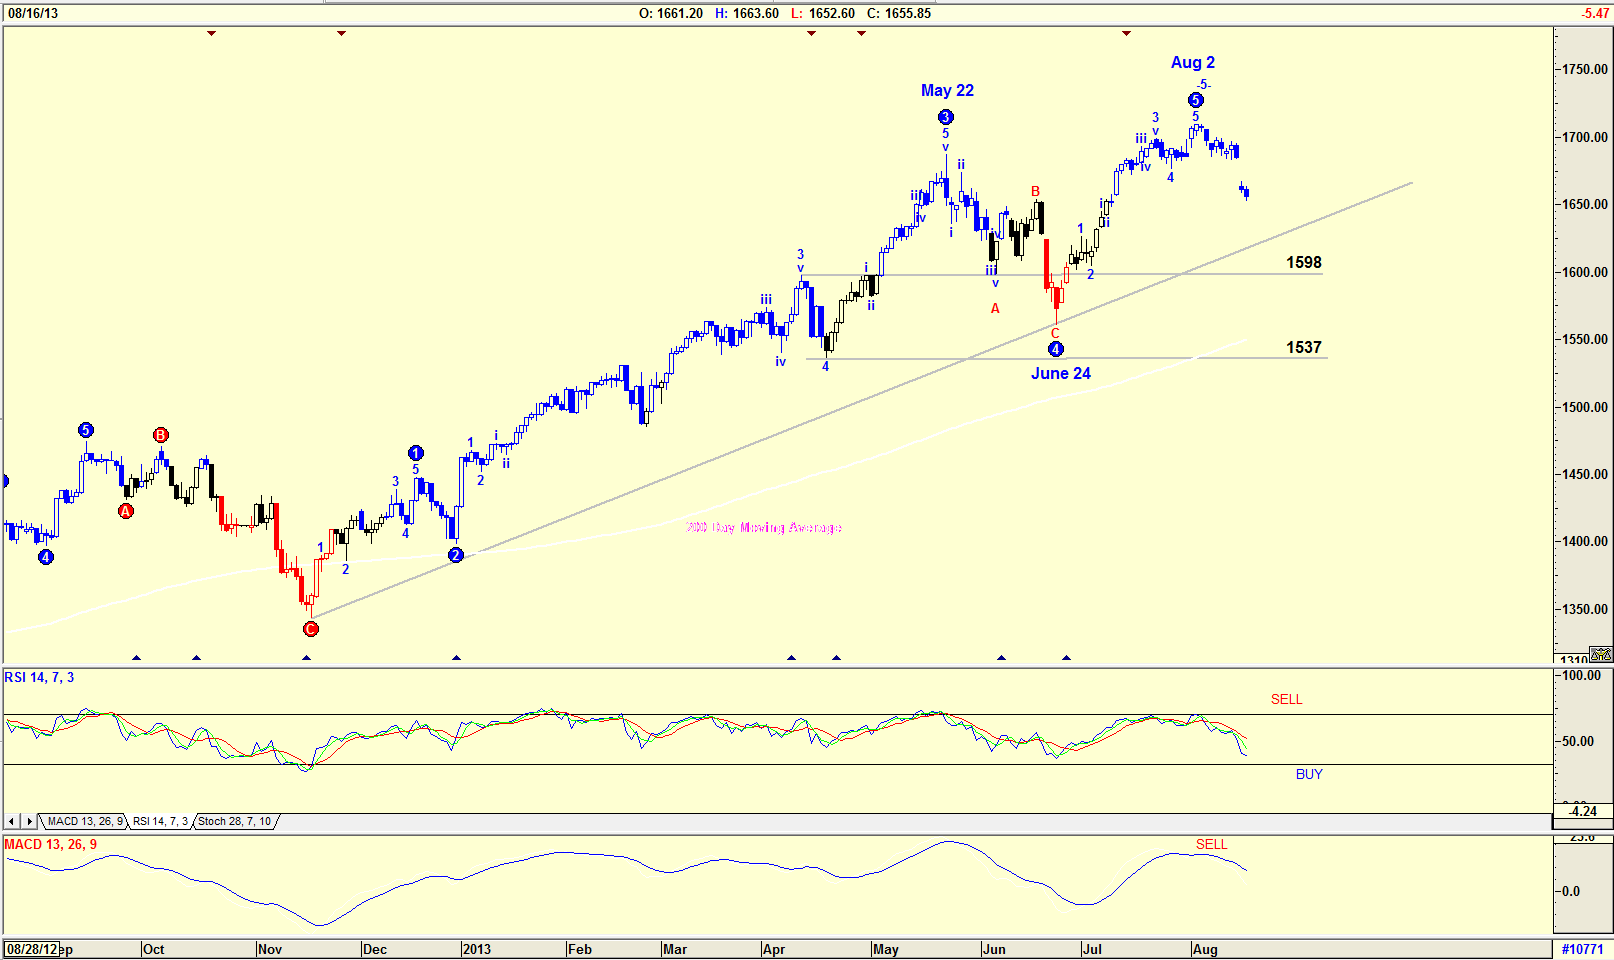
| Figure 2. S&P 500 Daily Index with Elliott Wave count. |
| Graphic provided by: AdvancedGET. |
| |
| The chart in Figure 2 is a daily chart of the S&P500 index that looks identical to the chart of the Dow Jones. The difference is that the recent correction is not testing the long-term support line. Also note that the Advanced GET program has not suggested a count for the correction, suggesting that a further downside is possible. The RSI indicator has not reached oversold levels, although the chart does show that on June 24, 2013, the RSI also did not reach oversold levels, and give a buy signal. The Elliott Wave rule that the index should correct to the 4th Wave of lesser degree, is suggesting a low of somewhere between 1537 and 1598. |
|
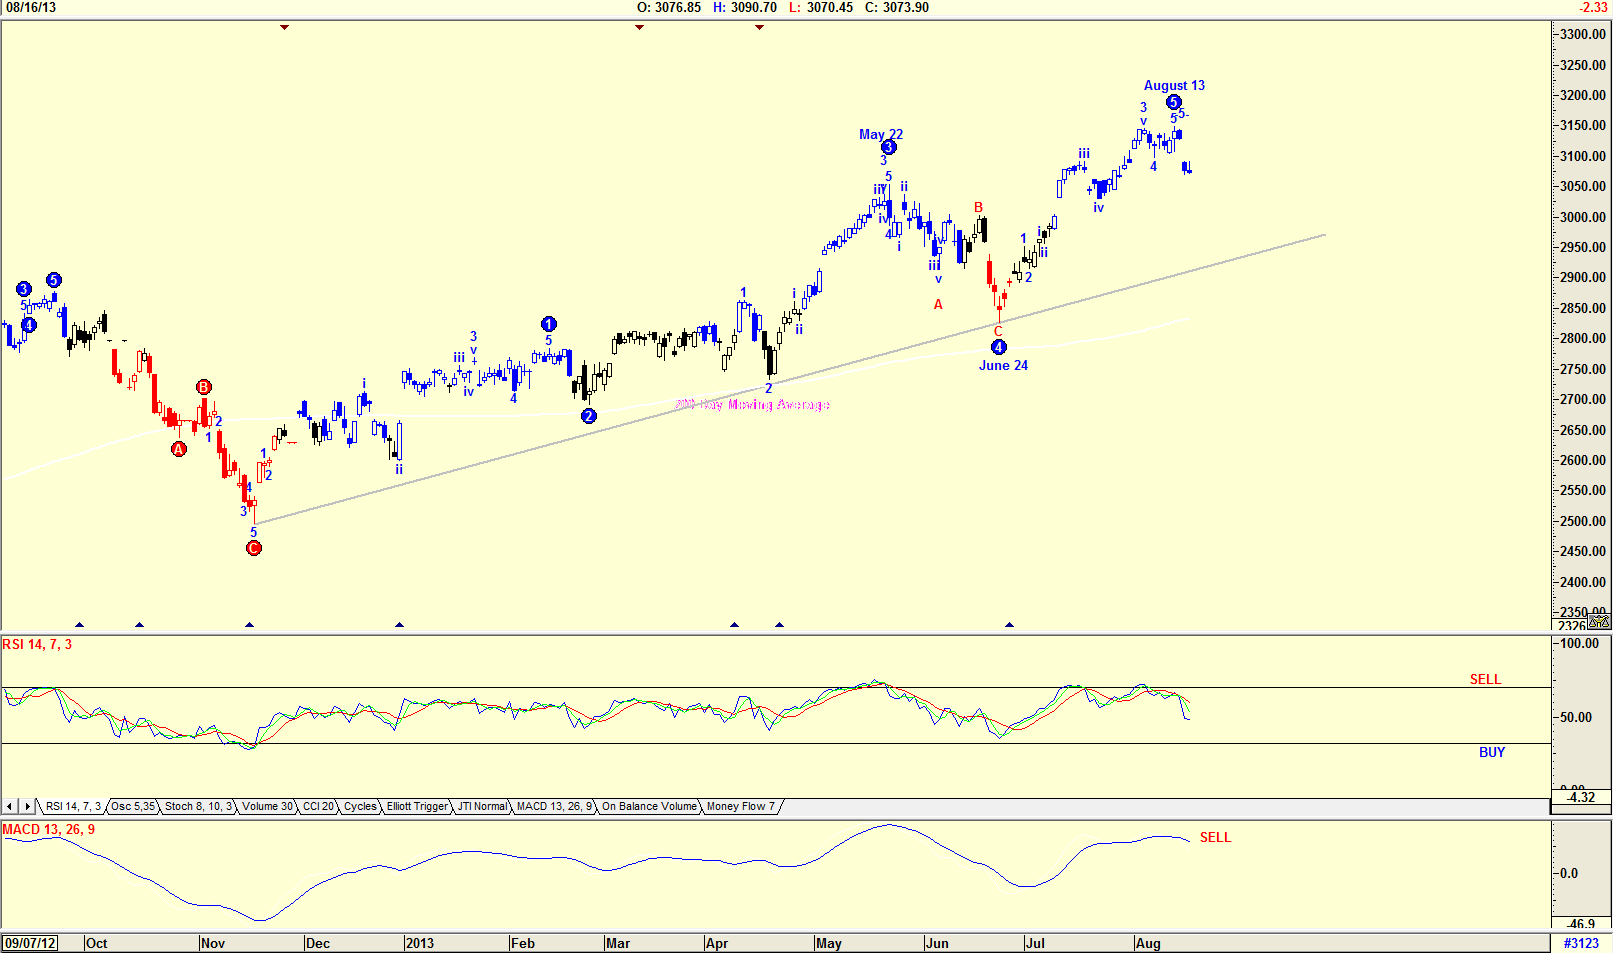
| Figure 3. Nasdaq Daily Index with Wave count. |
| Graphic provided by: AdvancedGET. |
| |
| The Nasdaq Index in Figure 3 has an Advanced GET Elliott Wave count that is identical to the Dow and the S&P500 index, namely it is tracing an ABC correction after a Wave 5 peak. The chart is suggesting that Wave top occurred on August 13, 2013, and not August 2, 2013, as suggested in the Dow and the S&P 500 index. The chart has not identified the WAVE A bottom as in Figure 1 of the Dow, suggesting that the price could move lower. The RSI indicator is also negative, as is the MACD Indicator. |
|
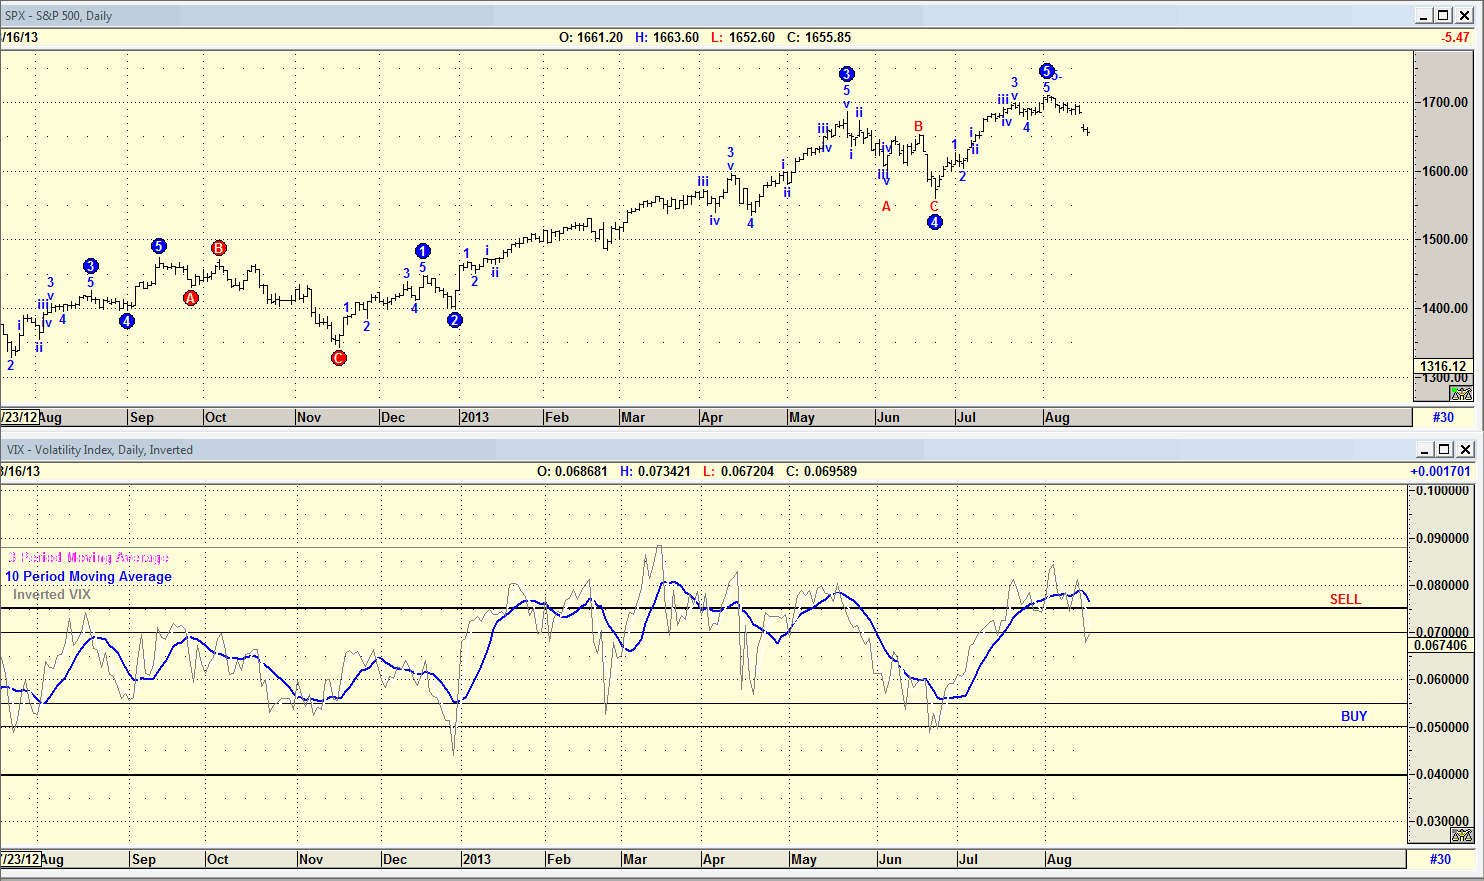
| Figure 4. VIX daily (inverted) with S&P 500 index. |
| Graphic provided by: AdvancedGET. |
| |
| All three charts are suggesting a further fall in the three indexes. This leads you to believe that the September quiet period is on the cards. The chart in Figure 4 is a chart of the S&P500 index with an inverted Volatility Index (VIX). The VIX usually moves opposite to the indexes; in other words, at index tops, the VIX is at its bottom. For easier reading, I have inverted the VIX on the chart, so that it moves in tandem with the indexes. I have then added the moving averages, three-period and 10-period to give buy and sell signals when the three-period crosses the 10-period moving average. Note how the VIX gave buy and sell signals in tandem with the S&P500 buy and sell signals. At the moment they are suggesting that the inverted VIX is falling suggesting a sell. It does look as if the market has further to fall in an ABC correction. The charts are suggesting that wave A is not completed. A Wave B up could bring optimism back to the market, but this will be temporary, followed by the sudden and swift Wave C down. The reason for this correction could be anything from Republican opposition to President Obama's economic plans to who knows what. Whatever the reason, start looking for shares you would like to own once the correction is complete, and start buying when everyone else is selling. |
Has been a technical analyst since 1969, and has worked as a futures and options trader with First Financial Futures in Johannesburg, South Africa.
| Address: | 3256 West 24th Ave |
| Vancouver, BC | |
| Phone # for sales: | 6042634214 |
| E-mail address: | petroosp@gmail.com |
Click here for more information about our publications!
Comments

Request Information From Our Sponsors
- StockCharts.com, Inc.
- Candle Patterns
- Candlestick Charting Explained
- Intermarket Technical Analysis
- John Murphy on Chart Analysis
- John Murphy's Chart Pattern Recognition
- John Murphy's Market Message
- MurphyExplainsMarketAnalysis-Intermarket Analysis
- MurphyExplainsMarketAnalysis-Visual Analysis
- StockCharts.com
- Technical Analysis of the Financial Markets
- The Visual Investor
- VectorVest, Inc.
- Executive Premier Workshop
- One-Day Options Course
- OptionsPro
- Retirement Income Workshop
- Sure-Fire Trading Systems (VectorVest, Inc.)
- Trading as a Business Workshop
- VectorVest 7 EOD
- VectorVest 7 RealTime/IntraDay
- VectorVest AutoTester
- VectorVest Educational Services
- VectorVest OnLine
- VectorVest Options Analyzer
- VectorVest ProGraphics v6.0
- VectorVest ProTrader 7
- VectorVest RealTime Derby Tool
- VectorVest Simulator
- VectorVest Variator
- VectorVest Watchdog