HOT TOPICS LIST
- MACD
- Fibonacci
- RSI
- Gann
- ADXR
- Stochastics
- Volume
- Triangles
- Futures
- Cycles
- Volatility
- ZIGZAG
- MESA
- Retracement
- Aroon
INDICATORS LIST
LIST OF TOPICS
PRINT THIS ARTICLE
by Donald W. Pendergast, Jr.
Up by nearly 110% since mid-summer 2012, shares of E-Trade Financial have pulled back to a minor support area. Is a new rally to be expected?
Position: N/A
Donald W. Pendergast, Jr.
Freelance financial markets writer and online publisher of the Trendzetterz.com S&P 500 Weekly Forecast service.
PRINT THIS ARTICLE
ELLIOTT WAVE
E-Trade Financial : More Fifth Wave Rally Due?
08/20/13 04:27:18 PMby Donald W. Pendergast, Jr.
Up by nearly 110% since mid-summer 2012, shares of E-Trade Financial have pulled back to a minor support area. Is a new rally to be expected?
Position: N/A
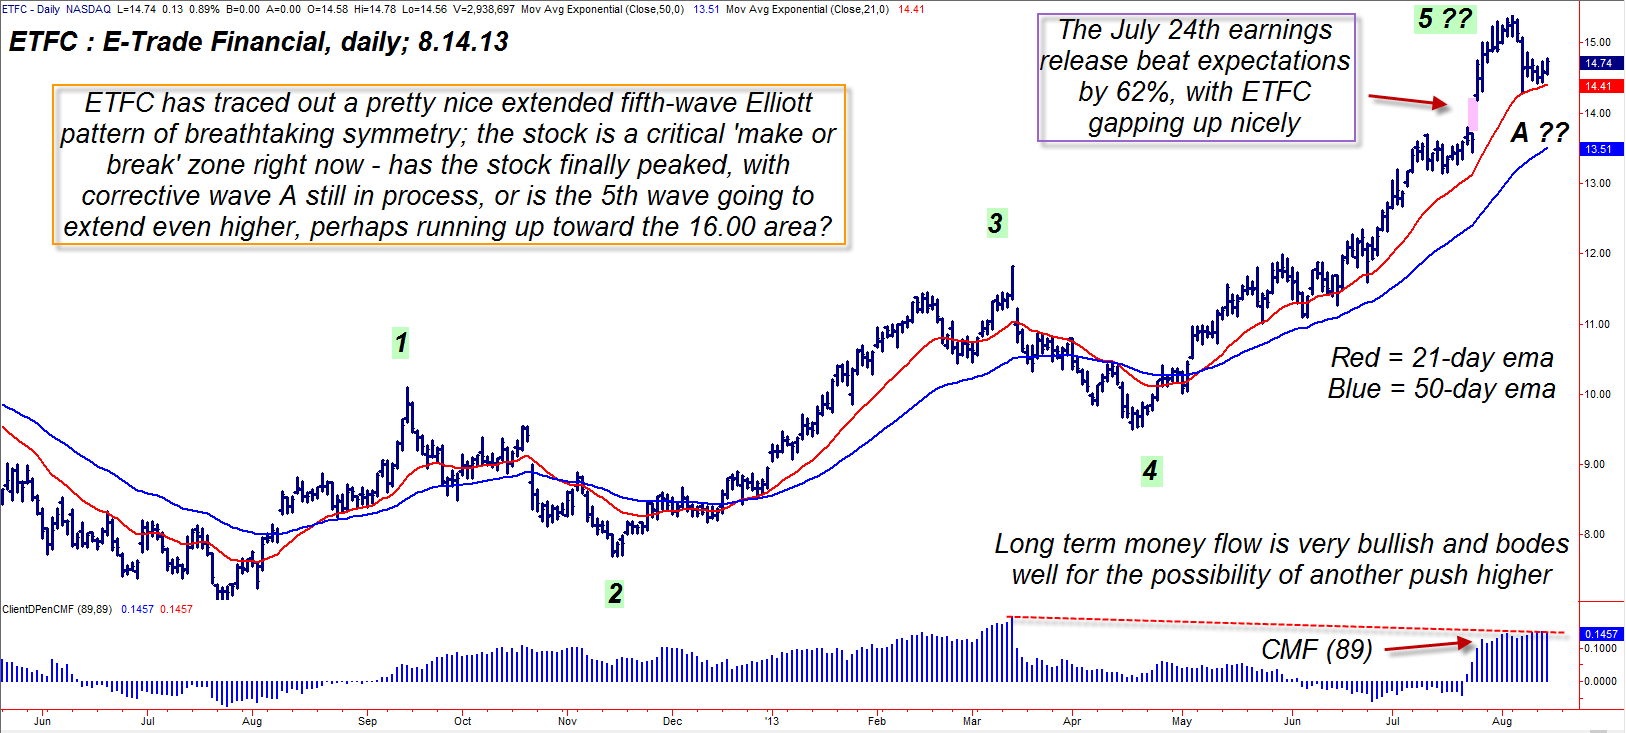
| Elliott Wave analysis techniques have been around for almost 80 years now, and although there is a lot of discussion about how effective this somewhat subjective style of technical analysis actually is, there can be no denying that the daily chart you see of E-Trade Financial Corporation (ETFC) in Figure 1 is a nice (but not perfect) example of an extended fifth wave Elliot pattern, one that lends itself to useful price projections — in either direction. Here's a closer look. |

|
| Figure 1. It's not a perfect Elliott 5-wave pattern, but it'll certainly do; ETFC appears to be planning to make one final thrust higher before a "major" corrective move commences. |
| Graphic provided by: TradeStation. |
| |
| Try as I might to locate them on a regular basis, it's tough to find a nicely-formed five-wave Elliott pattern in most of the stocks I follow; the sight of this unexpected Elliott gem on ETFC's daily chart was a nice surprise indeed, especially since the pattern is at or near its terminal phase, very close to a good tradable move in the days and weeks just ahead. Yes, this Elliott pattern features an extended fifth wave (typically seen near a blow off top in a given market), two of the three basic Elliot rules have also been fulfilled: 1. The third wave is not the shortest of the three motive waves. 2. The second wave did not retrace all of the gains of Wave one. Wave four did retrace into Wave one territory, but hey, trading and market analysis isn't about perfection, it's about probabilities, and the odds are looking mighty good that ETFC is getting ready to blast higher in one final thrust that "should" finally cap the massive rally that launched back on July 25, 2012. |

|
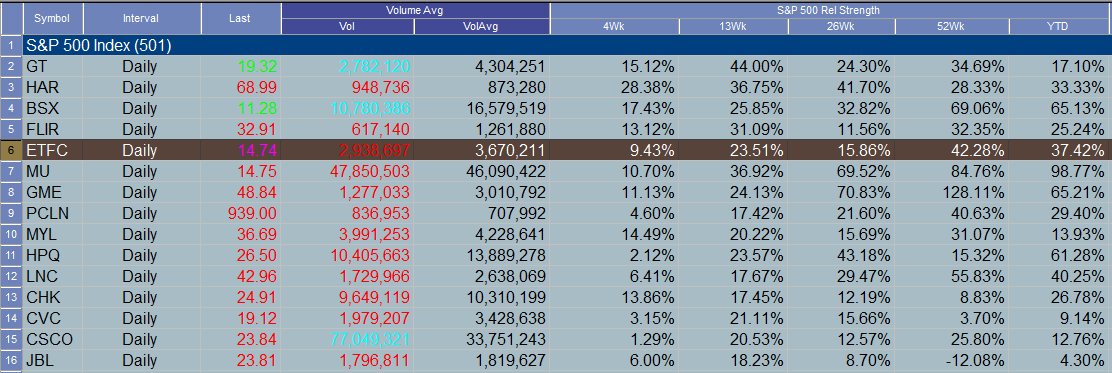
| Figure 2. E-Trade Financial (ETFC) is outperforming the .SPX by a wide margin over the past 12 months and on a year-to-date basis, too. |
| Graphic provided by: TradeStation. |
| Graphic provided by: TradeStation Radar Screen. |
| |
| Notice that ETFC has pulled back into a 20-day cycle low, one that rests right on top of the red 21-day exponential moving average (EMA)at the same time that the long-term money flow histogram (CMF)(89) is in an extremely bullish mode, with no signs of distribution yet. This money flow trend is a fairly reliable indication that the "smart money" intends to drive ETFC up in one final thrust, finally drawing in the last of the "sheep" before the inevitable slaughter — a long anticipated correction that should retrace 38 to 50% of ETFC's gains since summer 2012. |
| Playing ETFC here is simple — go long on a break above 14.78, set an initial stop near 14.44 and run a two-bar trailing stop of the daily lows until stopped out. If the stock hits 15.35, consider taking half of your profits, letting the rest run with the trail. Try not to risk more than 1% of your account value on this trade, given the extreme valuation of the stock at the moment. As always, trade wisely until we meet here again. |
Freelance financial markets writer and online publisher of the Trendzetterz.com S&P 500 Weekly Forecast service.
| Title: | Market consultant and writer |
| Company: | Trendzetterz |
| Address: | 81 Hickory Hollow Drive |
| Crossville, TN 38555 | |
| Phone # for sales: | 904-303-4814 |
| Website: | trendzetterz.com |
| E-mail address: | support@trendzetterz.com |
Traders' Resource Links | |
| Trendzetterz has not added any product or service information to TRADERS' RESOURCE. | |
Click here for more information about our publications!
Comments

Request Information From Our Sponsors
- StockCharts.com, Inc.
- Candle Patterns
- Candlestick Charting Explained
- Intermarket Technical Analysis
- John Murphy on Chart Analysis
- John Murphy's Chart Pattern Recognition
- John Murphy's Market Message
- MurphyExplainsMarketAnalysis-Intermarket Analysis
- MurphyExplainsMarketAnalysis-Visual Analysis
- StockCharts.com
- Technical Analysis of the Financial Markets
- The Visual Investor
- VectorVest, Inc.
- Executive Premier Workshop
- One-Day Options Course
- OptionsPro
- Retirement Income Workshop
- Sure-Fire Trading Systems (VectorVest, Inc.)
- Trading as a Business Workshop
- VectorVest 7 EOD
- VectorVest 7 RealTime/IntraDay
- VectorVest AutoTester
- VectorVest Educational Services
- VectorVest OnLine
- VectorVest Options Analyzer
- VectorVest ProGraphics v6.0
- VectorVest ProTrader 7
- VectorVest RealTime Derby Tool
- VectorVest Simulator
- VectorVest Variator
- VectorVest Watchdog
