HOT TOPICS LIST
- MACD
- Fibonacci
- RSI
- Gann
- ADXR
- Stochastics
- Volume
- Triangles
- Futures
- Cycles
- Volatility
- ZIGZAG
- MESA
- Retracement
- Aroon
INDICATORS LIST
LIST OF TOPICS
PRINT THIS ARTICLE
by Koos van der Merwe
When the indexes are falling, you should start looking for shares to buy as the indexes bottom.
Position: Accumulate
Koos van der Merwe
Has been a technical analyst since 1969, and has worked as a futures and options trader with First Financial Futures in Johannesburg, South Africa.
PRINT THIS ARTICLE
CUP WITH HANDLE
Is Sony Making A Comeback?
08/19/13 05:30:09 PMby Koos van der Merwe
When the indexes are falling, you should start looking for shares to buy as the indexes bottom.
Position: Accumulate
| One share that has had a tough go of things is Sony Corp (SNE). This is a share that has gone through tough times, since its high of $157.78 in the year 2000. We all know that Sony Corporation designs, develops, manufactures, and sells electronic equipment, that is, LCD televisions, home and car audio, blu-ray players, etc. The company also produces, PlayStation, popular with children around the world. The company also engages in the production, and distribution of television programs, motion pictures, and animated films. It also provides various financial services, including life and non-life insurance, savings products, and loans; engages in the research, development, design, production, marketing, sale, distribution, and servicing of mobile phones, accessories, and applications. In other words Sony is everywhere, probably one of the reasons why the share price collapsed so dramatically over the years. |

|
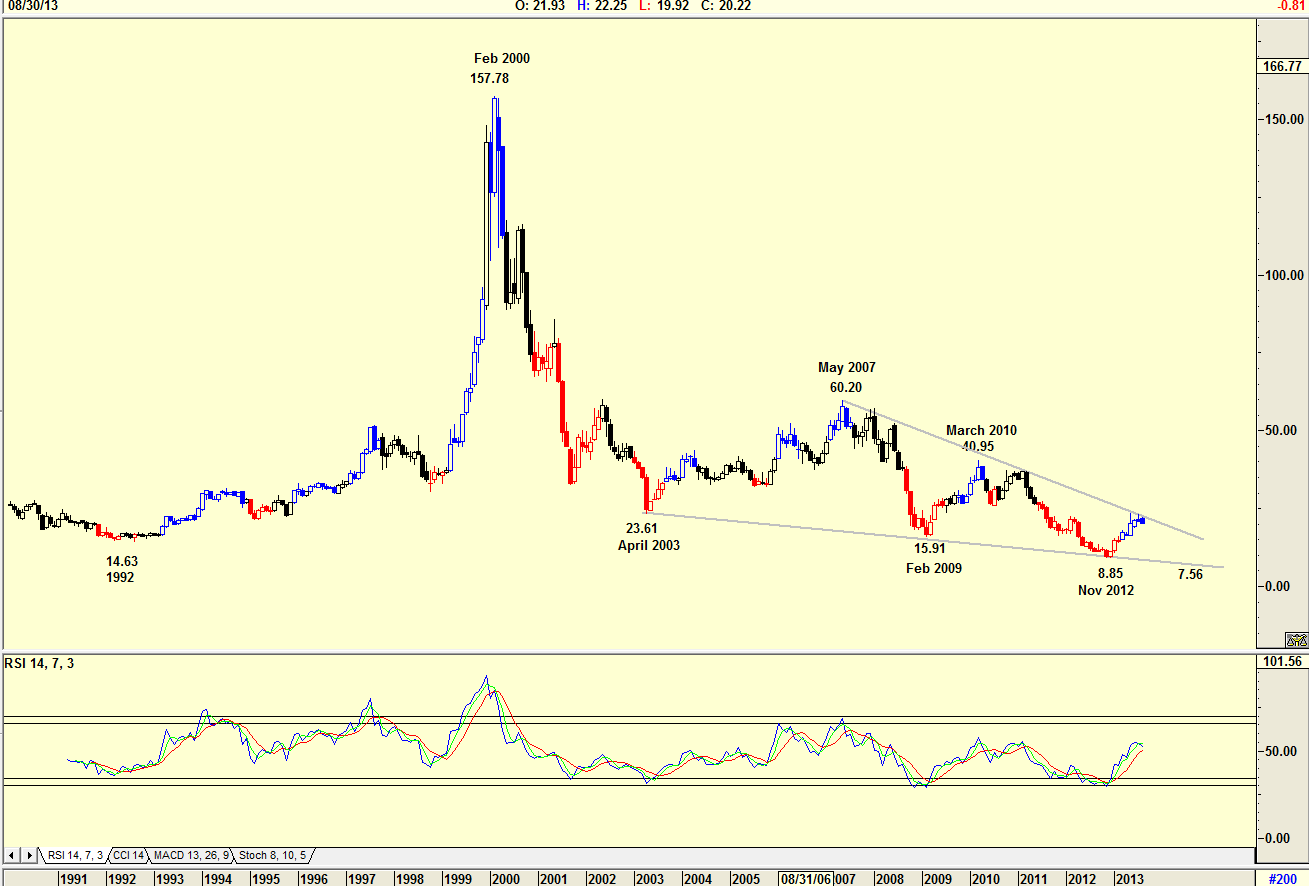
| Figure 1. Monthly chart of Sony Corp. |
| Graphic provided by: AdvancedGET. |
| |
| The monthly chart in Figure 1 shows how the price rose from a low of $14.63 in 1992 to a high of $157.78 by February 2000. The price fell as the technology bubble burst to a low of $23.61 by April 2003. The RSI gave a buy signal, and the price rose to $60.20 by May 2007. On an RSI sell, it fell to $15.921 by February 2009, then recovered on an RSI buy to $40.95 by March 2010, and has since collapsed to a new low of $8.85 by November 2012. With the RSI indicator suggesting a buy signal, you wonder if the share is worth a buy. The share price is testing a resistance line, suggesting that the price could drop to retest the support line in the $7.56 area. |

|
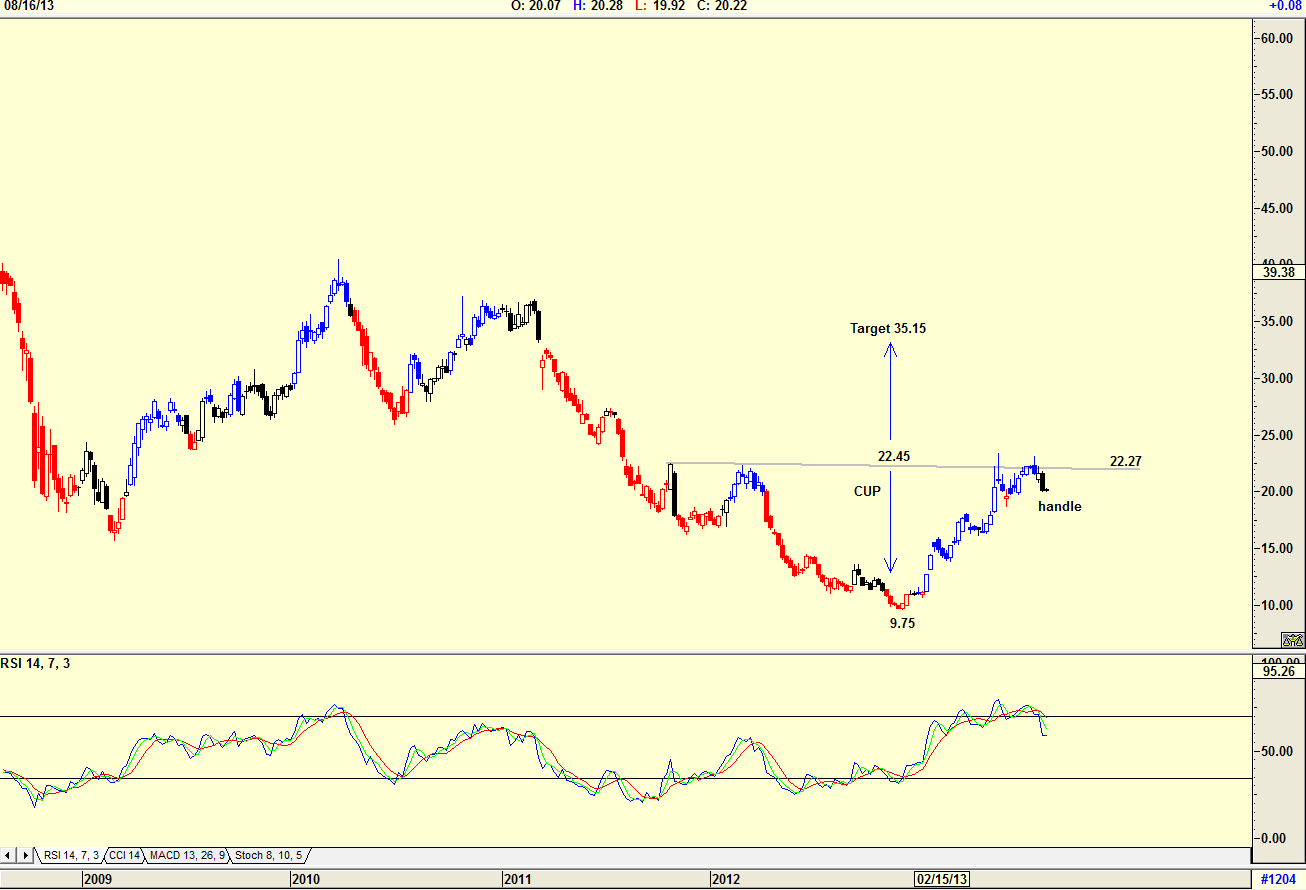
| Figure 2. Weekly chart of Sony showing cup & handle pattern developing. |
| Graphic provided by: AdvancedGET. |
| |
| The weekly chart in Figure 2 suggests that a cup and handle formation has developed. Should the price rise and move above the resistance at $22.27, then the target for the share price becomes $35.15. (22.45-9.75=12.70+22.45=35.15). Note that the RSI indicator has given a sell signal, which suggests that it could take some time before the share price tests that $22.27 resistance. |

|
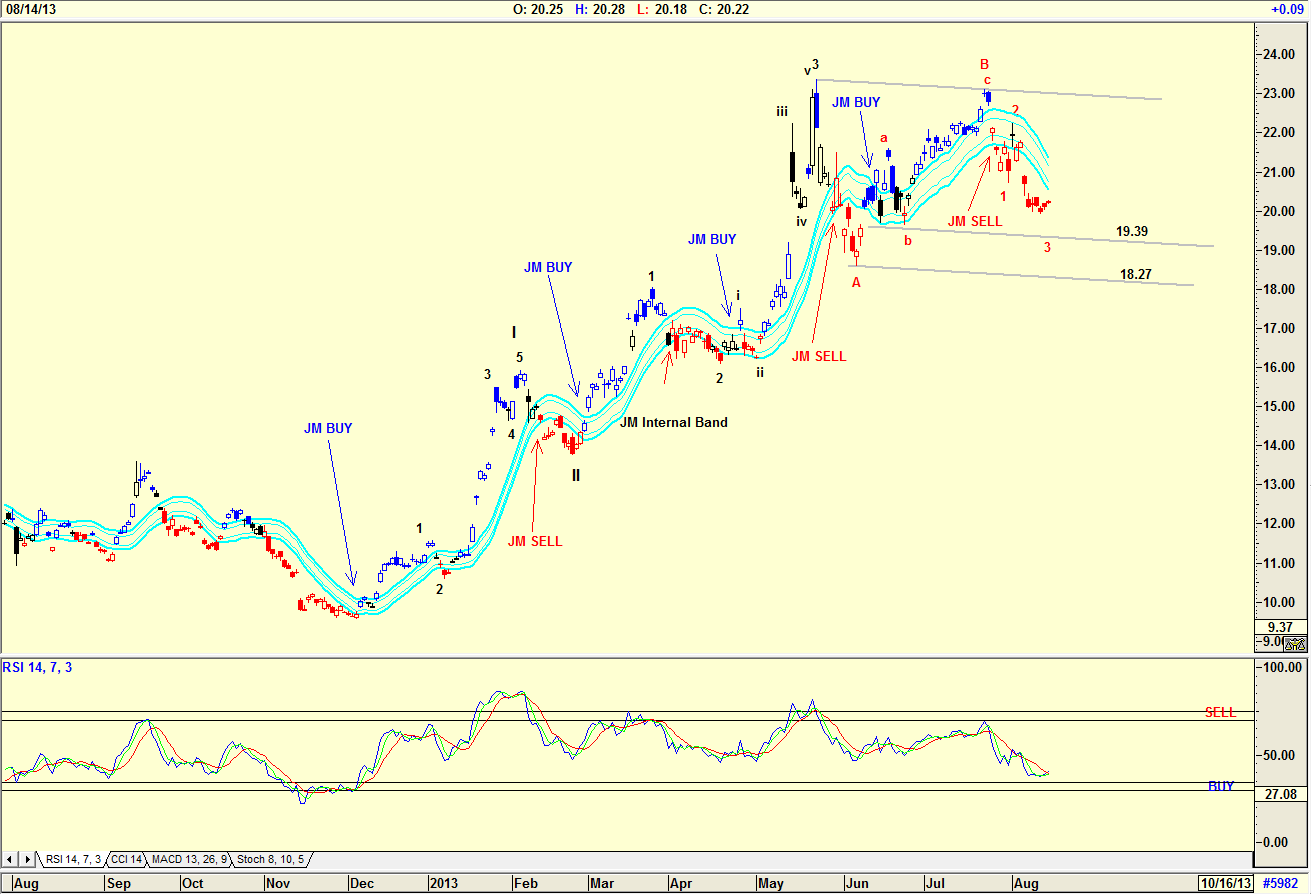
| Figure 3. Daily chart of Sony Corp. with preferred Elliott Wave Count and JM Internal Band Indicator. |
| Graphic provided by: AdvancedGET. |
| |
| The daily chart in Figure 3 shows my preferred Elliott Wave count. This suggests that SNE is tracing a C-Wave which could see it find support at either $19.39 or $18.27. The RSI indicator has not fallen below the 32 level, the buy zone, suggesting more downside. Also, note that the JM Internal band is still negative. I would not be a buyer of SNE at present levels, but I would place the share on my watch list as a future buy once the RSI suggests a buy or, to be more conservative, when a buy signal is given on the JM internal band. |
Has been a technical analyst since 1969, and has worked as a futures and options trader with First Financial Futures in Johannesburg, South Africa.
| Address: | 3256 West 24th Ave |
| Vancouver, BC | |
| Phone # for sales: | 6042634214 |
| E-mail address: | petroosp@gmail.com |
Click here for more information about our publications!
Comments

|

Request Information From Our Sponsors
- StockCharts.com, Inc.
- Candle Patterns
- Candlestick Charting Explained
- Intermarket Technical Analysis
- John Murphy on Chart Analysis
- John Murphy's Chart Pattern Recognition
- John Murphy's Market Message
- MurphyExplainsMarketAnalysis-Intermarket Analysis
- MurphyExplainsMarketAnalysis-Visual Analysis
- StockCharts.com
- Technical Analysis of the Financial Markets
- The Visual Investor
- VectorVest, Inc.
- Executive Premier Workshop
- One-Day Options Course
- OptionsPro
- Retirement Income Workshop
- Sure-Fire Trading Systems (VectorVest, Inc.)
- Trading as a Business Workshop
- VectorVest 7 EOD
- VectorVest 7 RealTime/IntraDay
- VectorVest AutoTester
- VectorVest Educational Services
- VectorVest OnLine
- VectorVest Options Analyzer
- VectorVest ProGraphics v6.0
- VectorVest ProTrader 7
- VectorVest RealTime Derby Tool
- VectorVest Simulator
- VectorVest Variator
- VectorVest Watchdog
