HOT TOPICS LIST
- MACD
- Fibonacci
- RSI
- Gann
- ADXR
- Stochastics
- Volume
- Triangles
- Futures
- Cycles
- Volatility
- ZIGZAG
- MESA
- Retracement
- Aroon
INDICATORS LIST
LIST OF TOPICS
PRINT THIS ARTICLE
by David Penn
As the CRB Index heads toward resistance, the grains struggle to keep their bull markets alive.
Position: N/A
David Penn
Technical Writer for Technical Analysis of STOCKS & COMMODITIES magazine, Working-Money.com, and Traders.com Advantage.
PRINT THIS ARTICLE
REVERSAL
December Corn's 2B Test of Top
09/13/02 07:41:10 AMby David Penn
As the CRB Index heads toward resistance, the grains struggle to keep their bull markets alive.
Position: N/A
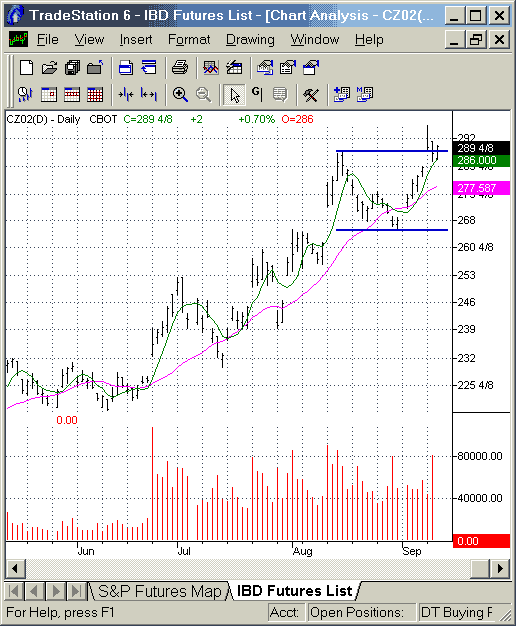
| How long will the commodities rally continue? As the CRB Index hurtles toward the resistance left over from the Index's 2000 peak, traders will turn their attention toward the constituents of the CRB Index for signs of weakness in leading commodities such as crude oil, wheat, soybeans, and gold. Each of these commodities is part of CRB subgroups that have contributed mightily to the CRB bull market in 2002. In fact, only the livestock subgroup has lagged behind. One of the constituents of the grains subgroup, December corn, provides an opportunity to see the commodities rally up close. December corn put in a bottom in May 2002 with a low of about 215. CZ2 most recently closed at 287.50, a gain of over 33% or $3,625 per contract. Most recently, December corn made a new high in early August of 288.50, corrected to support at 265.75 and rallied to make a new high at 296 early in September. |
| Conventional trend-following wisdom suggests that new highs are often excellent signals of market strength. Of course, this conventional wisdom has been challenged by -- essentially -- those on the other side of the trade who see new highs often as instances of temporary exuberance that is all but bound to correct. There is an argument that the most effective trader is the trader that can follow a trend, but is quick to reverse or close out the position when evidence suggests that the trend is going to reverse. For those who have enjoyed following the trend in December corn, the 2B test is one quick way to assess the likelihood of a profitable trend reversal. |

|
| Figure 1: The bull market in December corn makes a new high in September. Will more advances follow? |
| Graphic provided by: TradeStation. |
| |
| The 2B test, popularized by Victor Sperandeo in his pair of Trader Vic books ("Method of a Wall Street Master" and "Principles of Professional Speculation") is a very simple method for attempting to pick tops and bottoms in markets. One of the problems of picking a top or bottom is that the trader often ends up being correct that a top or bottom is imminent, but too late or too early to take maximum advantage of the situation. The 2B test allows the trader to make a fairly easy "bet" on a trend reversal, which allows the trader to exit or reverse the losing position early as well, should the trade turn into a loser. |
| As Victor Sperandeo explains it, a 2B test of top occurs when prices make a new high, correct by a significant (though preferably not overwhelming) amount, then go on to make an even higher high. The "test of top" occurs when prices fail to follow through after the higher high and, instead, close below the previous new high. At this point, per the 2B method, the trader would initiate a short position with stop-buy protection in the area of the previous highs. In order to determine a 2B test of bottom, the trader would look for a new low, a rally, then a lower low. If there is no follow-through on the downside (prices close above the first new low), then the trader would initiate a long position with stop-sell protection in the area of the previous lows. |
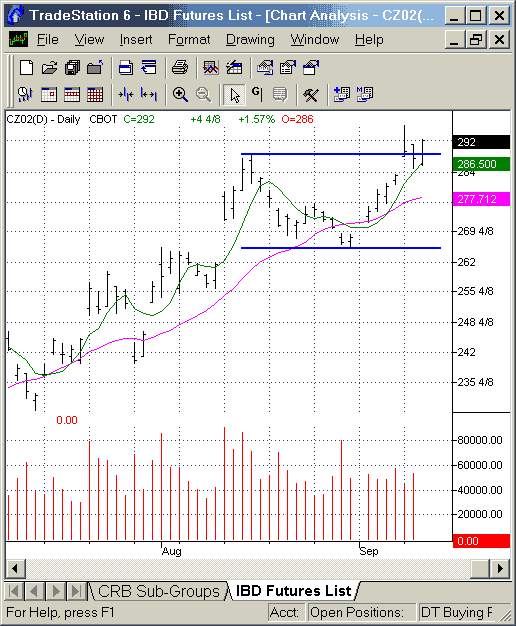
 Figure 2: A close-up of the 2B test of top in December corn. Using the December corn contract as an example, note first the new high made on August 15th. CZ2 corrected somewhat over the balance of August and began to rally going into September. On September 9th, December corn made a higher high yet, on the following day, prices retreated back beneath the level of the previous new high made on August 15th. This would be the signal to enter a short trade on September 11th. What makes the 2B test of top (and bottom) worthwhile is not the fact that the test always produces winning trades. But what the test does appear to do is help traders find low risk entry points for potentially sizable rewards. As long as strict trade management rules are maintained (such as exiting short 2B trades if a new high is reached), the 2B test is an excellent tool for both trend-followers and trend-reversal traders to make (and take) the most out of the markets. |
Technical Writer for Technical Analysis of STOCKS & COMMODITIES magazine, Working-Money.com, and Traders.com Advantage.
| Title: | Technical Writer |
| Company: | Technical Analysis, Inc. |
| Address: | 4757 California Avenue SW |
| Seattle, WA 98116 | |
| Phone # for sales: | 206 938 0570 |
| Fax: | 206 938 1307 |
| Website: | www.Traders.com |
| E-mail address: | DPenn@traders.com |
Traders' Resource Links | |
| Charting the Stock Market: The Wyckoff Method -- Books | |
| Working-Money.com -- Online Trading Services | |
| Traders.com Advantage -- Online Trading Services | |
| Technical Analysis of Stocks & Commodities -- Publications and Newsletters | |
| Working Money, at Working-Money.com -- Publications and Newsletters | |
| Traders.com Advantage -- Publications and Newsletters | |
| Professional Traders Starter Kit -- Software | |
Click here for more information about our publications!
Comments
Date: 09/19/02Rank: 4Comment: Well I would have preferred at least one example with Candles, but otherwise, thanks.

Request Information From Our Sponsors
- StockCharts.com, Inc.
- Candle Patterns
- Candlestick Charting Explained
- Intermarket Technical Analysis
- John Murphy on Chart Analysis
- John Murphy's Chart Pattern Recognition
- John Murphy's Market Message
- MurphyExplainsMarketAnalysis-Intermarket Analysis
- MurphyExplainsMarketAnalysis-Visual Analysis
- StockCharts.com
- Technical Analysis of the Financial Markets
- The Visual Investor
- VectorVest, Inc.
- Executive Premier Workshop
- One-Day Options Course
- OptionsPro
- Retirement Income Workshop
- Sure-Fire Trading Systems (VectorVest, Inc.)
- Trading as a Business Workshop
- VectorVest 7 EOD
- VectorVest 7 RealTime/IntraDay
- VectorVest AutoTester
- VectorVest Educational Services
- VectorVest OnLine
- VectorVest Options Analyzer
- VectorVest ProGraphics v6.0
- VectorVest ProTrader 7
- VectorVest RealTime Derby Tool
- VectorVest Simulator
- VectorVest Variator
- VectorVest Watchdog
