HOT TOPICS LIST
- MACD
- Fibonacci
- RSI
- Gann
- ADXR
- Stochastics
- Volume
- Triangles
- Futures
- Cycles
- Volatility
- ZIGZAG
- MESA
- Retracement
- Aroon
INDICATORS LIST
LIST OF TOPICS
PRINT THIS ARTICLE
by Donald W. Pendergast, Jr.
Up by an astounding 49% in just seven weeks, shares of Harman International may be poised to surge even higher.
Position: N/A
Donald W. Pendergast, Jr.
Freelance financial markets writer and online publisher of the Trendzetterz.com S&P 500 Weekly Forecast service.
PRINT THIS ARTICLE
KELTNER CHANNELS
Harman International : Powerful Uptrend
08/16/13 01:12:55 PMby Donald W. Pendergast, Jr.
Up by an astounding 49% in just seven weeks, shares of Harman International may be poised to surge even higher.
Position: N/A
| The major US stock indexes continue to trade near their recent all-time highs, helped along by equity hi-fliers like Harman International (HAR). Here's a closer look at some of the technical and fundamental factors that make this stock an attractive covered call play. |

|
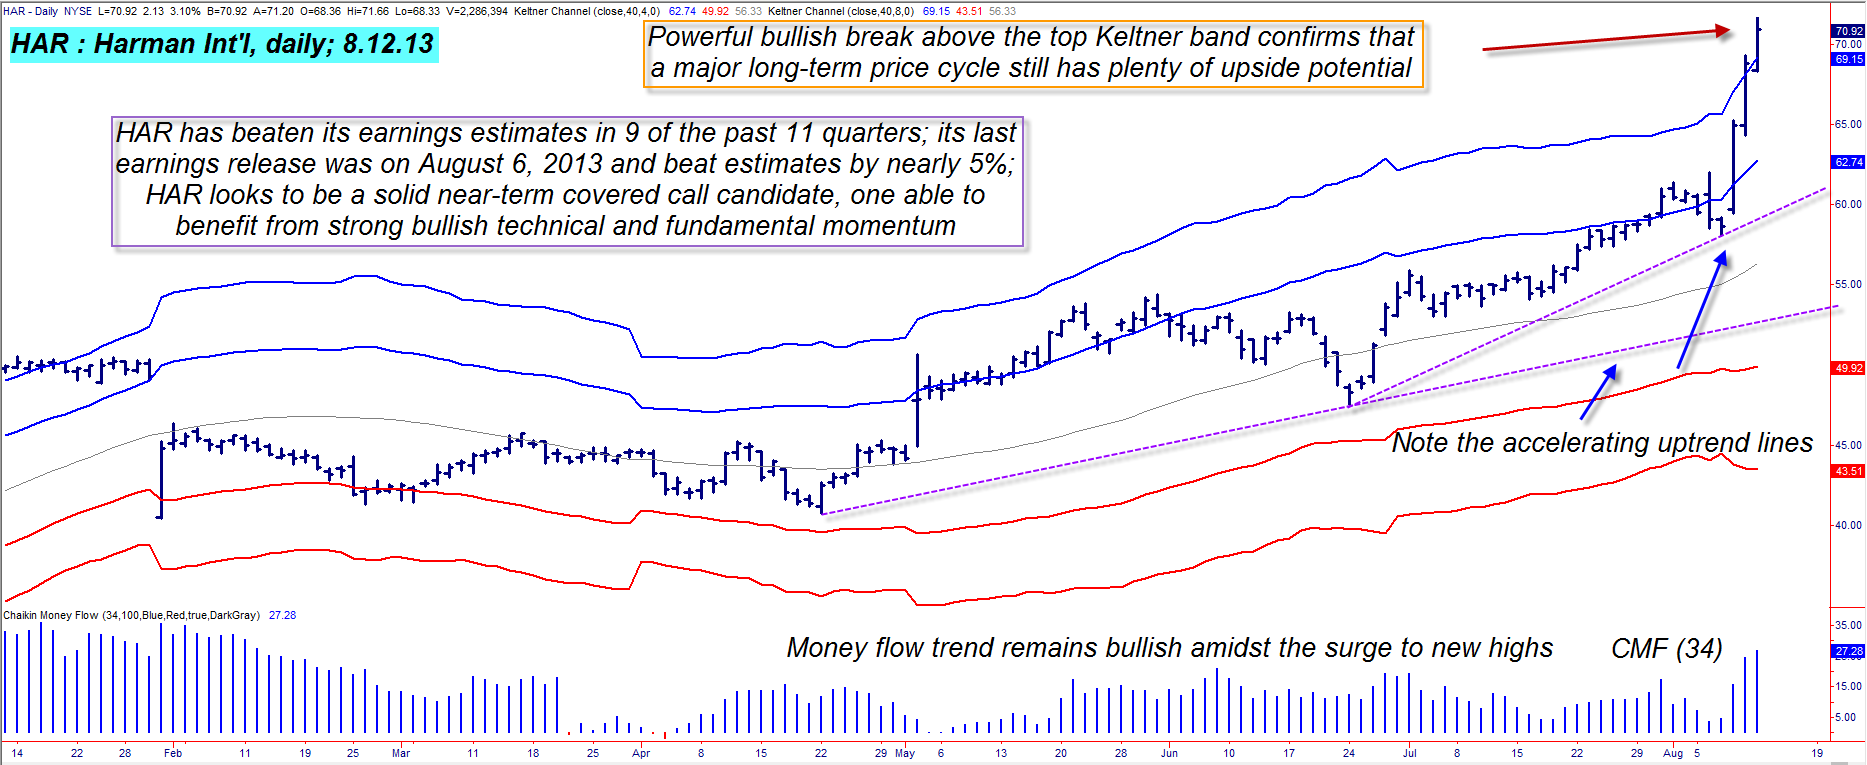
| Figure 1: Harman International (HAR) continues to rocket higher after beating its earnings estimates on August 6, 2013. |
| Graphic provided by: TradeStation. |
| |
| The market-wide rally coming out of the June 24, 2013 cycle low has been very impressive (Figure 1), but not too many stocks have made the same kind of gains that HAR has - averaging about 7% per week is an incredible rate of return for a widely-traded stock - and the truly incredible thing is that HAR's daily chart technicals suggests that the stock may still have a ways to rise before an inevitable correction kicks in, purging off some "irrational exuberance." HAR's medium-term money flow histogram (based on the 34-day Chaikin Money flow indicator or (CMF)(34))is still well above its zero line, even as the stock is breaking above its uppermost Keltner channel. Breaks above the topmost channel are fairly rare, implying that a high-degree price cycle is the driver intent on pushing the stock noticeably higher. Stocks with high relative strength vs. the broad market are the favorites of many institutional money managers/traders, as are those that have a solid history of beating their quarterly earnings estimates, and HAR is a natural choice for such market players (the "smart money" powerhouses that make up the bulk of all trading action in the equities markets) to deploy some of their cash into. Typically, stocks that break above the top Keltner are rewarded with more upside (FYI, the extreme outer Keltner bands are set at 8 ATR's away from a 40-day moving average), so this could be a great setup for swing traders and covered call traders to latch on to. Using the September '13 HAR $70 call option looks to be one of the smartest ways to go the covered call route in this stock; these calls are slightly in-the-money (ITM) and have a reasonable bid/ask spread and an open interest figure of 107 contracts. The big idea is to sell one of these calls for every 100 shares of HAR that you acquire, hopefully being able to hold the trade through September options expiration - until your shares are called away from you and you walk away with a decent profit. |

|
| Figure 2.: HAR is outperforming the .SPX over the last 4-, 13-, 26- and 52-week periods. |
| Graphic provided by: TradeStation. |
| Graphic provided by: TradeStation Radar Screen. |
| |
| Normally, a 21-day exponential moving average (EMA) can be used as a trailing stop for most covered calls, but since HAR is so far extended above the average now, it might be wiser to run a 9- or 13- day EMA instead, closing out the trade on a daily close below the average. In addition, limiting account risk to 1% would also be advisable because of the steep rise in the stock over the past few sessions; regardless, "buy high, sell higher" still looks like a great strategy in this situation with HAR. Stocks with consistently great earnings, high relative strength and Keltner - shattering momentum usually make great covered call/swing trading candidates and HAR certainly looks like a top-shelf play for the bulls here. Trade wisely until we meet here again. |
Freelance financial markets writer and online publisher of the Trendzetterz.com S&P 500 Weekly Forecast service.
| Title: | Market consultant and writer |
| Company: | Trendzetterz |
| Address: | 81 Hickory Hollow Drive |
| Crossville, TN 38555 | |
| Phone # for sales: | 904-303-4814 |
| Website: | trendzetterz.com |
| E-mail address: | support@trendzetterz.com |
Traders' Resource Links | |
| Trendzetterz has not added any product or service information to TRADERS' RESOURCE. | |
Click here for more information about our publications!
Comments
Date: 08/22/13Rank: 5Comment:

Request Information From Our Sponsors
- StockCharts.com, Inc.
- Candle Patterns
- Candlestick Charting Explained
- Intermarket Technical Analysis
- John Murphy on Chart Analysis
- John Murphy's Chart Pattern Recognition
- John Murphy's Market Message
- MurphyExplainsMarketAnalysis-Intermarket Analysis
- MurphyExplainsMarketAnalysis-Visual Analysis
- StockCharts.com
- Technical Analysis of the Financial Markets
- The Visual Investor
- VectorVest, Inc.
- Executive Premier Workshop
- One-Day Options Course
- OptionsPro
- Retirement Income Workshop
- Sure-Fire Trading Systems (VectorVest, Inc.)
- Trading as a Business Workshop
- VectorVest 7 EOD
- VectorVest 7 RealTime/IntraDay
- VectorVest AutoTester
- VectorVest Educational Services
- VectorVest OnLine
- VectorVest Options Analyzer
- VectorVest ProGraphics v6.0
- VectorVest ProTrader 7
- VectorVest RealTime Derby Tool
- VectorVest Simulator
- VectorVest Variator
- VectorVest Watchdog
