

HOT TOPICS LIST
- MACD
- Fibonacci
- RSI
- Gann
- ADXR
- Stochastics
- Volume
- Triangles
- Futures
- Cycles
- Volatility
- ZIGZAG
- MESA
- Retracement
- Aroon
INDICATORS LIST
LIST OF TOPICS
PRINT THIS ARTICLE
by Chaitali Mohile
The bullish run of Yadkin Bank may be ready to reverse.
Position: N/A
Chaitali Mohile
Active trader in the Indian stock markets since 2003 and a full-time writer. Trading is largely based upon technical analysis.
PRINT THIS ARTICLE
CANDLESTICK CHARTING
YDKN Halts For A While
08/15/13 01:22:04 PMby Chaitali Mohile
The bullish run of Yadkin Bank may be ready to reverse.
Position: N/A
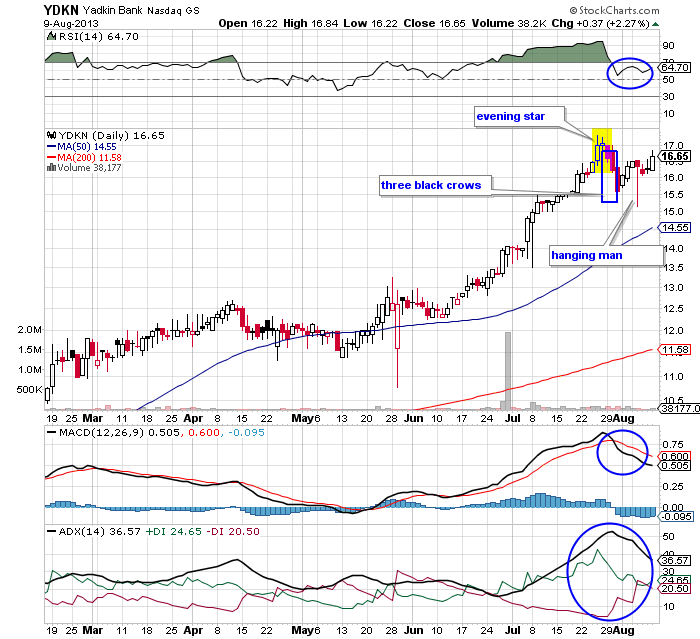
| Yadkin Bank (YDKN) is a slow moving stock. The stock gained $7 over a period of six months. The small candlesticks on the daily chart in Figure 1 show steady price movement. Due to the weak bullish support the candlesticks developed upper and lower shadows. Initially, the stock lacked a strong uptrend, resulting in a tricky bullish rally. Gradually, the stock rushed with robust bullish support of 50-day moving average (MA), developing a fresh uptrend and an increasing bullish momentum. |
|
| FIGURE 1: YDKN, DAILY. |
| Graphic provided by: StockCharts.com. |
| |
| YDKN hit $17 and dragged all the three indicators to their extreme bullish levels (Figure 1). The relative strength index (RSI) (14) turned overbought, indicating the possibility of a bullish reversal. The average directional index (ADX) (14) reached 50 levels, suggesting an overheated uptrend, and the moving average convergence/divergence (MACD) (12,26,9) turned volatile in positive territory. These bearish reversal indications were confirmed by an evening star candlestick pattern followed by the three black crows candlestick pattern. These two bearish reversal candlestick patterns pulled the overheated technical indicators lower in their bullish zones. |
| The price of YDKN, however, did not drop immediately on these bearish notes. It surged a few points and formed a hanging man bearish reversal formation. Note that the indicators have not plunged in bearish regions even after these multiple bearish reversal candlestick formations. Therefore, the price rally is likely to sustain its bullish levels. The reversal signals will probably only make the bullish rally less steep. |
|
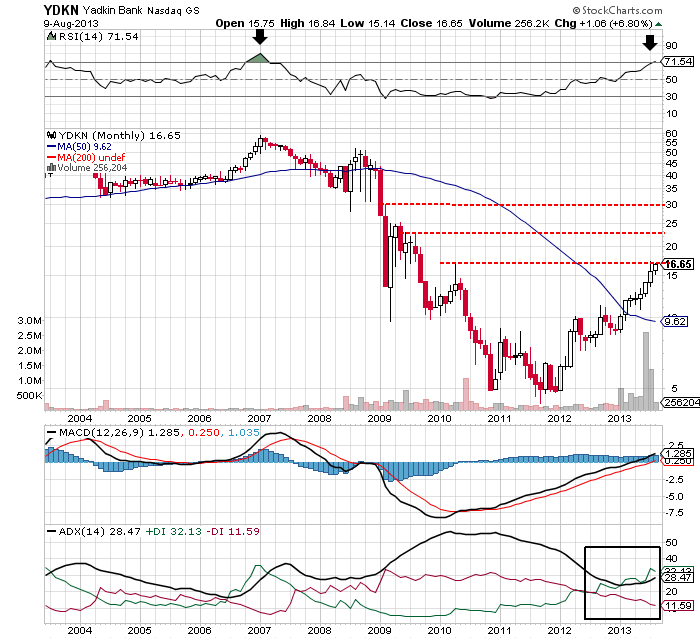
| FIGURE 2: YDKN, MONTHLY. |
| Graphic provided by: StockCharts.com. |
| |
| On the monthly chart in Figure 2, a bullish breakout of a rounded bottom formation has hit previous high resistance. This resistance is likely to suppress the breakout rally, and would consolidate horizontally. The three red dotted lines on the price chart shows resistance for the future rally. Therefore, YDKN would continue its slow price action. |
| In addition, the uptrend is developing, and the MACD (12,26,9) is ready to shift into positive territory. Hence, they would help the stock to establish strong support under the resistance. The jittery RSI (14) is likely to induce volatility in the rally. This would result in narrow range bound price action during consolidation. Hence, the bullish rally of YDKN would consolidate for a short time span, and later, the bullish breakout could resume its rally. |
Active trader in the Indian stock markets since 2003 and a full-time writer. Trading is largely based upon technical analysis.
| Company: | Independent |
| Address: | C1/3 Parth Indraprasth Towers. Vastrapur |
| Ahmedabad, Guj 380015 | |
| E-mail address: | chaitalimohile@yahoo.co.in |
Traders' Resource Links | |
| Independent has not added any product or service information to TRADERS' RESOURCE. | |
Click here for more information about our publications!
PRINT THIS ARTICLE

Request Information From Our Sponsors
- StockCharts.com, Inc.
- Candle Patterns
- Candlestick Charting Explained
- Intermarket Technical Analysis
- John Murphy on Chart Analysis
- John Murphy's Chart Pattern Recognition
- John Murphy's Market Message
- MurphyExplainsMarketAnalysis-Intermarket Analysis
- MurphyExplainsMarketAnalysis-Visual Analysis
- StockCharts.com
- Technical Analysis of the Financial Markets
- The Visual Investor
- VectorVest, Inc.
- Executive Premier Workshop
- One-Day Options Course
- OptionsPro
- Retirement Income Workshop
- Sure-Fire Trading Systems (VectorVest, Inc.)
- Trading as a Business Workshop
- VectorVest 7 EOD
- VectorVest 7 RealTime/IntraDay
- VectorVest AutoTester
- VectorVest Educational Services
- VectorVest OnLine
- VectorVest Options Analyzer
- VectorVest ProGraphics v6.0
- VectorVest ProTrader 7
- VectorVest RealTime Derby Tool
- VectorVest Simulator
- VectorVest Variator
- VectorVest Watchdog