HOT TOPICS LIST
- MACD
- Fibonacci
- RSI
- Gann
- ADXR
- Stochastics
- Volume
- Triangles
- Futures
- Cycles
- Volatility
- ZIGZAG
- MESA
- Retracement
- Aroon
INDICATORS LIST
LIST OF TOPICS
PRINT THIS ARTICLE
by Koos van der Merwe
Will President Obama get the Republican controlled Congress to agree to Obamacare? The stock market seems to think so.
Position: Buy
Koos van der Merwe
Has been a technical analyst since 1969, and has worked as a futures and options trader with First Financial Futures in Johannesburg, South Africa.
PRINT THIS ARTICLE
TECHNICAL ANALYSIS
HCA Holdings, Inc.
08/15/13 01:13:12 PMby Koos van der Merwe
Will President Obama get the Republican controlled Congress to agree to Obamacare? The stock market seems to think so.
Position: Buy
| HCA Holdings, Inc. operates more than 160 acute care, psychiatric, and rehabilitation hospitals in the US and UK. The company also runs more than 100 ambulatory surgery centers, as well as cancer treatment and outpatient rehab centers that form health care networks in many of the communities it serves. In total, its hospitals are home to more than 40,500 beds. HCA's facilities are located in 20 states; roughly half of its hospitals are in Florida and Texas. HCA International operates hospitals and clinics in the UK. |

|
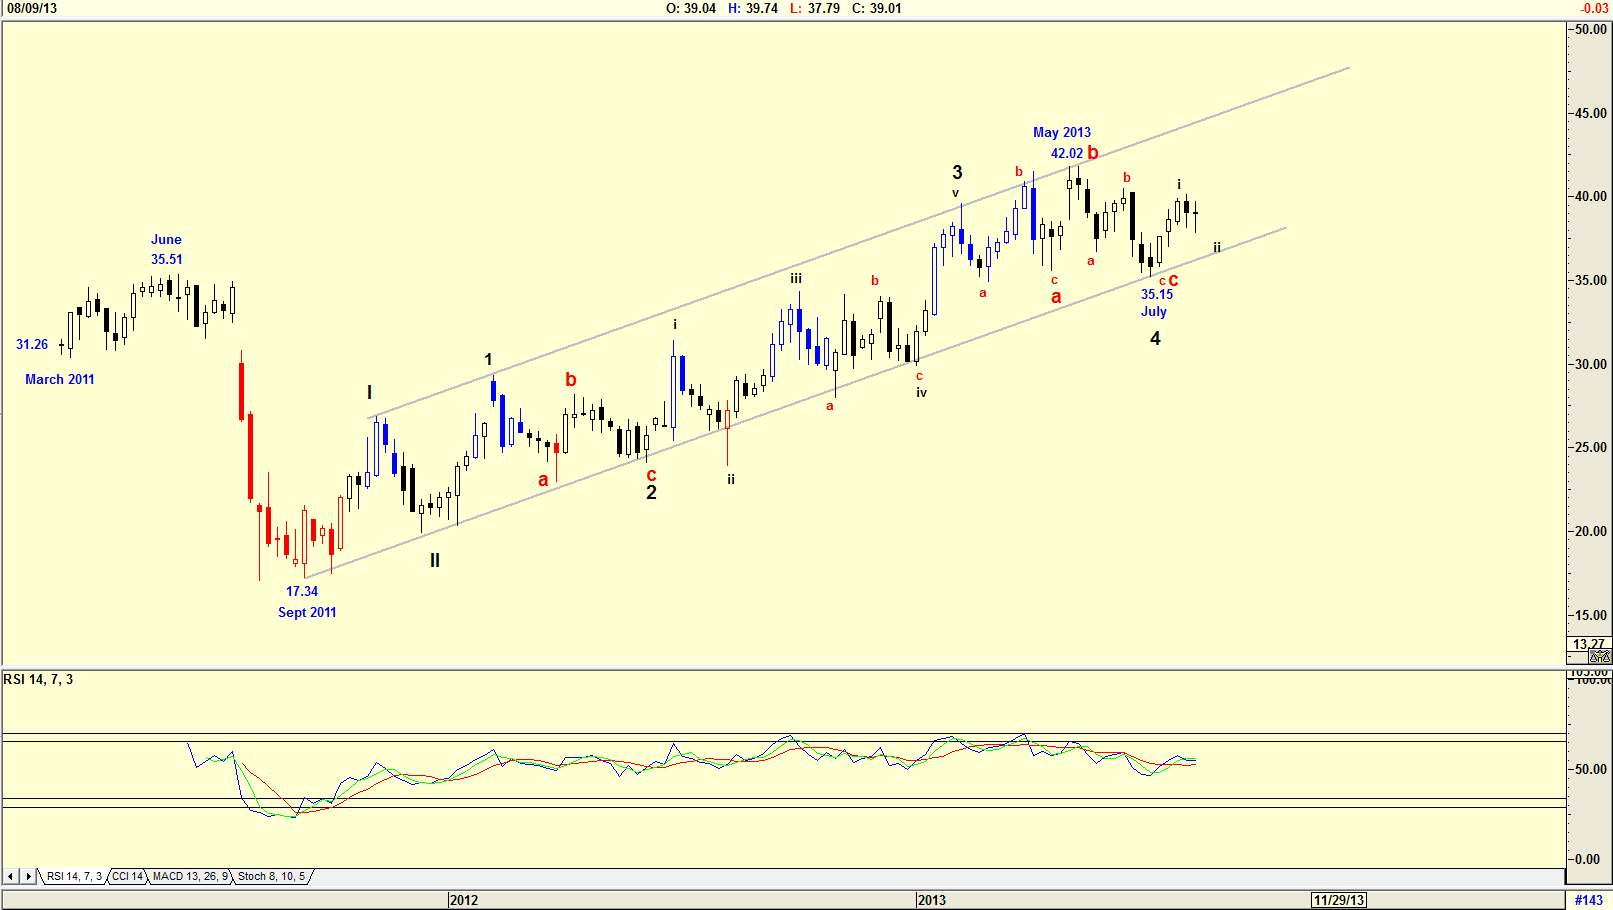
| Figure 1 Weekly chart |
| Graphic provided by: AdvancedGET. |
| |
| The weekly chart in Figure 1 shows the opening price of $31.26 when the share went public in November. The share price rose to $35.51 by June, but then fell to $17.34 by September 2011. Since then the price rose strongly to $42.02 by May 2013. The share price then fell to $35.15, the support line in what appears to be an Elliott 4th Wave correction in a WAVE III. The RSI indicator is suggesting weakness. The wave count is suggesting a wave ii correction in a Wave 5 of WAVE III. |

|
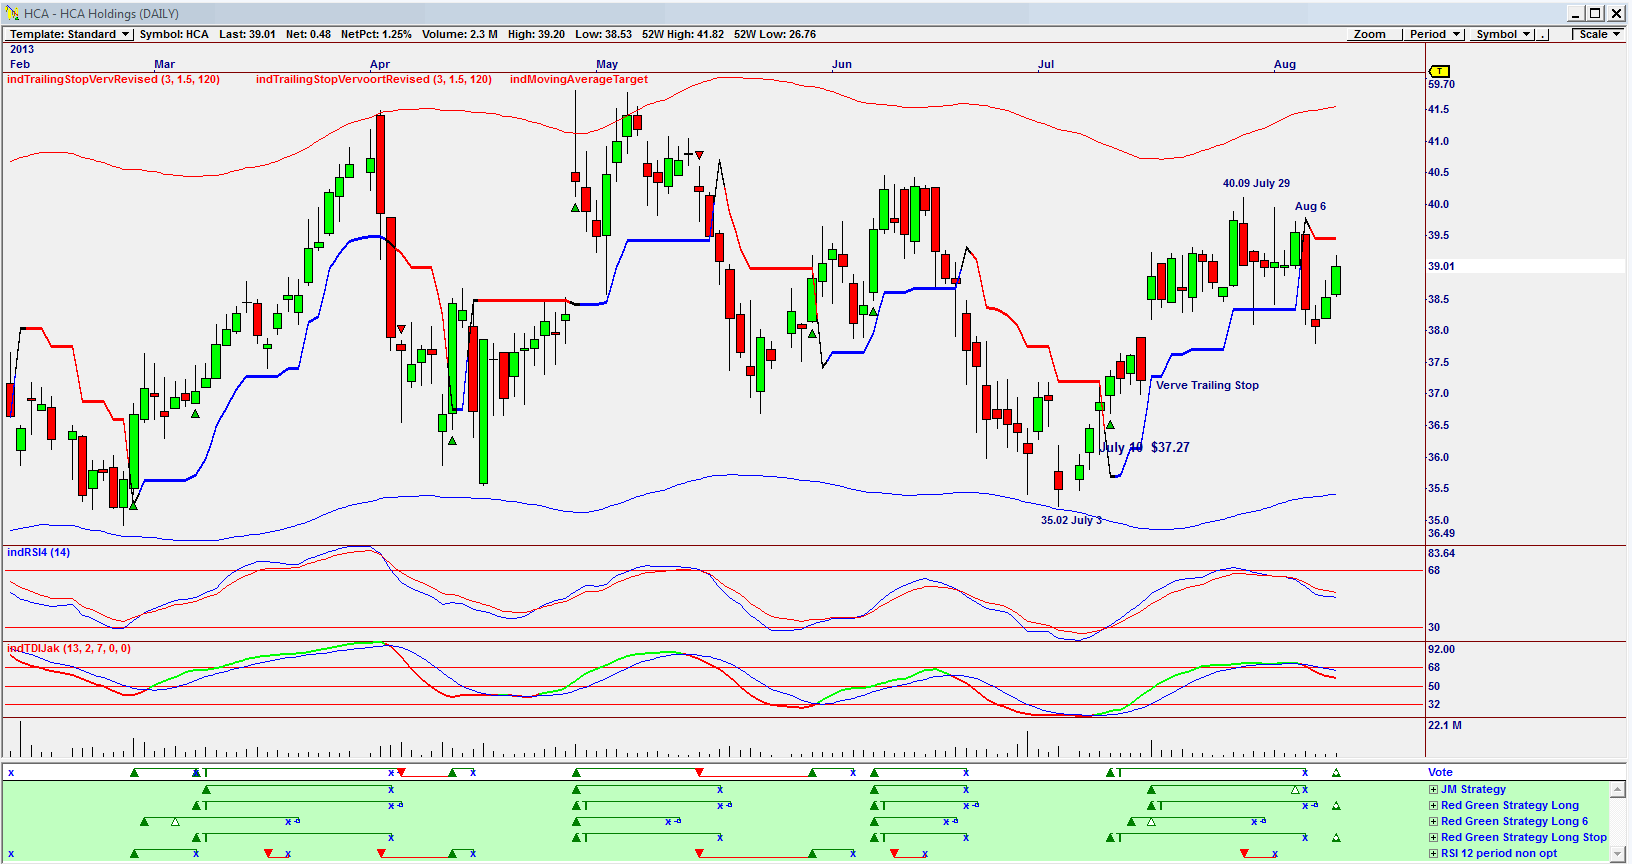
| Figure 2 Daily chart |
| Graphic provided by: Omnitrader. |
| |
| The chart in Figure 2 is an Omnitrader chart suggesting a buy signal with an advisor rating (not shown) of 60 based on the two red green strategies shown below the vote line. The chart shows that the share price touched the lower buy band at $35.02 on July 3, 2013. The vote line only gave a buy signal on July 10, 2013 at $37.27 and the price rose to a high of $40.09 on July 29, 2013. The price then fell, giving a major sell signal as it broke through the VERVE trailing stop on August 6, 2013. Both indicators, the 14-period RSI and the TDI indicators are showing weakness. I would be a buyer of the share because of the strength of the buy signal given by the VOTE line and that the share price has not risen to the upper band. However, because of the negativity of the two indicators, I would watch the share closely, and keep my stops close. |
Has been a technical analyst since 1969, and has worked as a futures and options trader with First Financial Futures in Johannesburg, South Africa.
| Address: | 3256 West 24th Ave |
| Vancouver, BC | |
| Phone # for sales: | 6042634214 |
| E-mail address: | petroosp@gmail.com |
Click here for more information about our publications!
PRINT THIS ARTICLE

Request Information From Our Sponsors
- StockCharts.com, Inc.
- Candle Patterns
- Candlestick Charting Explained
- Intermarket Technical Analysis
- John Murphy on Chart Analysis
- John Murphy's Chart Pattern Recognition
- John Murphy's Market Message
- MurphyExplainsMarketAnalysis-Intermarket Analysis
- MurphyExplainsMarketAnalysis-Visual Analysis
- StockCharts.com
- Technical Analysis of the Financial Markets
- The Visual Investor
- VectorVest, Inc.
- Executive Premier Workshop
- One-Day Options Course
- OptionsPro
- Retirement Income Workshop
- Sure-Fire Trading Systems (VectorVest, Inc.)
- Trading as a Business Workshop
- VectorVest 7 EOD
- VectorVest 7 RealTime/IntraDay
- VectorVest AutoTester
- VectorVest Educational Services
- VectorVest OnLine
- VectorVest Options Analyzer
- VectorVest ProGraphics v6.0
- VectorVest ProTrader 7
- VectorVest RealTime Derby Tool
- VectorVest Simulator
- VectorVest Variator
- VectorVest Watchdog
