HOT TOPICS LIST
- MACD
- Fibonacci
- RSI
- Gann
- ADXR
- Stochastics
- Volume
- Triangles
- Futures
- Cycles
- Volatility
- ZIGZAG
- MESA
- Retracement
- Aroon
INDICATORS LIST
LIST OF TOPICS
PRINT THIS ARTICLE
by Donald W. Pendergast, Jr.
Shares of Grupo Financiero Santander Mexico have risen sharply over the past week, but will a powerful resistance area be able to hold this bank stock back-or not?
Position: N/A
Donald W. Pendergast, Jr.
Freelance financial markets writer and online publisher of the Trendzetterz.com S&P 500 Weekly Forecast service.
PRINT THIS ARTICLE
SUPPORT & RESISTANCE
BSMX : Nearing Significant Resistance
08/14/13 03:13:34 PMby Donald W. Pendergast, Jr.
Shares of Grupo Financiero Santander Mexico have risen sharply over the past week, but will a powerful resistance area be able to hold this bank stock back-or not?
Position: N/A
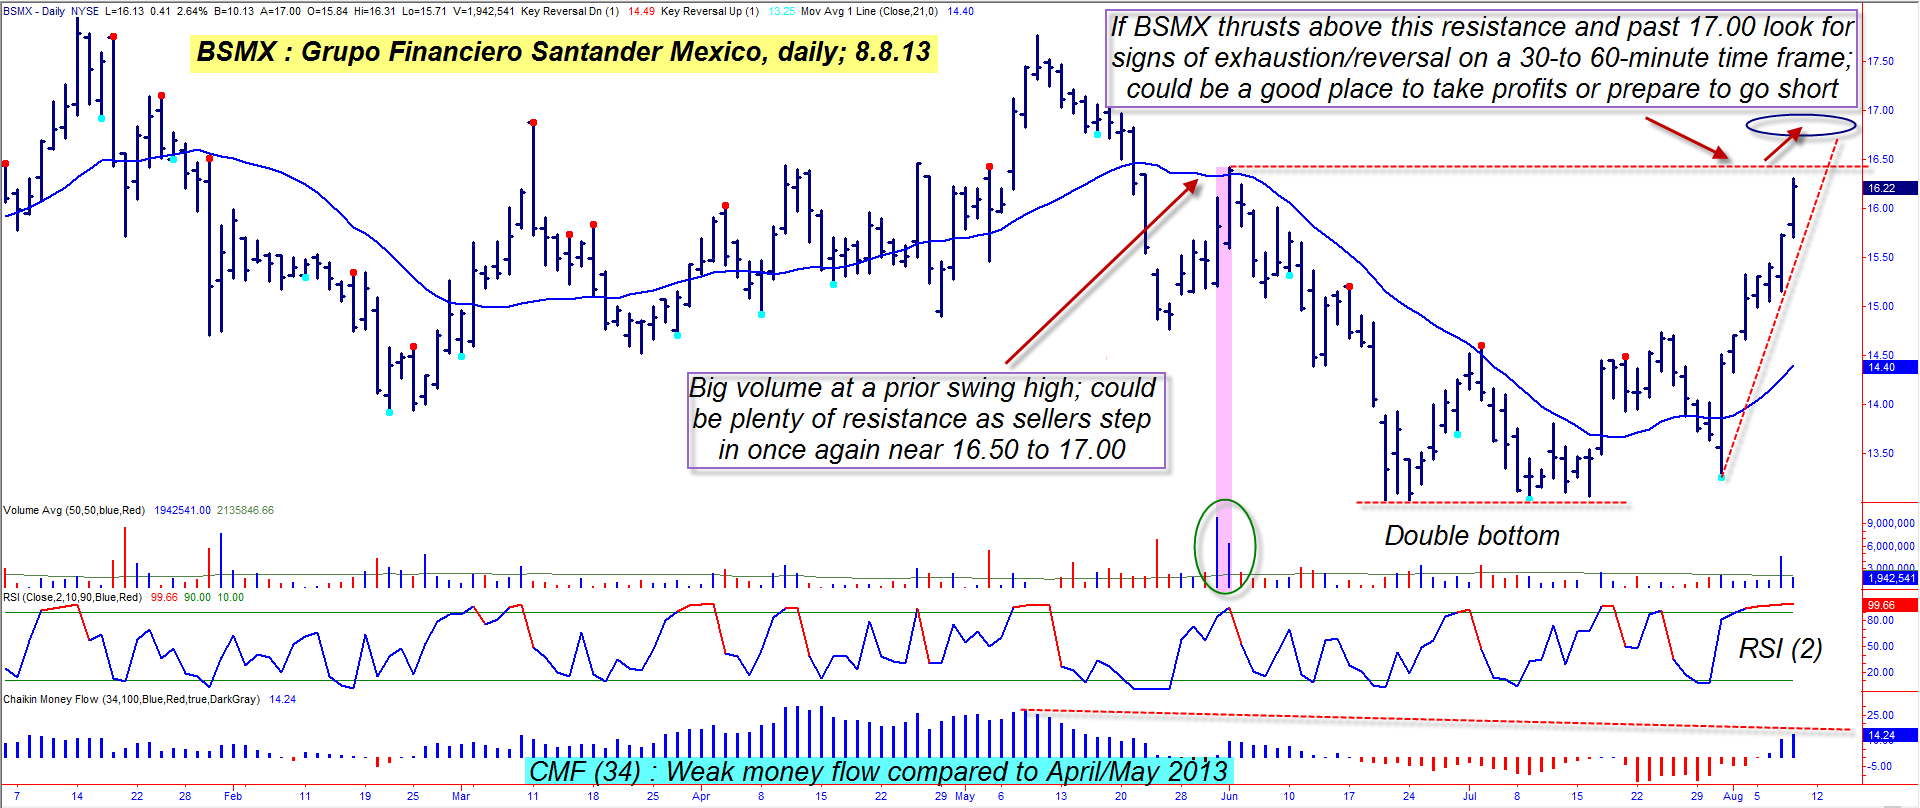
| Grupo Financiero Santander Mexico (BSMX) shares only have a 10-month trading history on the NYSE, but a quick glance at its daily chart confirms that this financial sector stock has plenty of volatility, average daily trading volume, and swing move potential to be of interest to serious day and swing traders. The stock has rallied nicely over the past seven trading sessions but is just a few cents shy of meeting a key resistance level - a level that previously saw sellers step in to abort further upside back in June 2013. Here's a look at what could be BSMX's final approach into a tradable cycle high and reversal (Figure 1). |

|
| Figure 1.: BSMX has rallied by more than 22% in just seven trading sessions; mediocre fundamentals, weak money flows and a potentially strong area of resistance between 16.42 and 17.50 could all combine to create a bearish reversal soon. |
| Graphic provided by: TradeStation. |
| |
| The bullish case for BSMX looks something like this: 1. The stock printed a valid double bottom pattern between June/July 2013, one that was successfully tested on the final trading session in July. 2. The stock has risen sharply since then and is up by more than 22% in just seven trading sessions. 3. Its medium-term money flow histogram is above its zero line. 4. BSMX is also trending well above its upward-sloping 21-day moving average. At the same time, however, there are potentially bearish warning signs: 1. The latest average broker recommendation for BSMX is 3.25, which is rather bearish. 2. The medium-term money flow histogram, although nominally bullish, is at a level far below those seen in the spring of 2013, despite similar valuations in the stock. 3. The two-day RSI is nearly maxed out (close to 100)and its four-day RSI is also getting close to the 95.00 area. 4. The stock has made seven consecutive higher closes and is now very close to hitting a key resistance area at 16.42. If you're currently long BSMX and have some nice open gains, consider lightening up should it surge above 16.50 and flirt with the 17.00 area; there was a lot of trading volume at the resistance level formed by the June 6, 2013 swing high, and that's where sellers stepped in to hold back its rally attempt. Given the weaker money flow trend now, it's conceivable that the same thing could happen again, with BSMX reversing lower. |

|
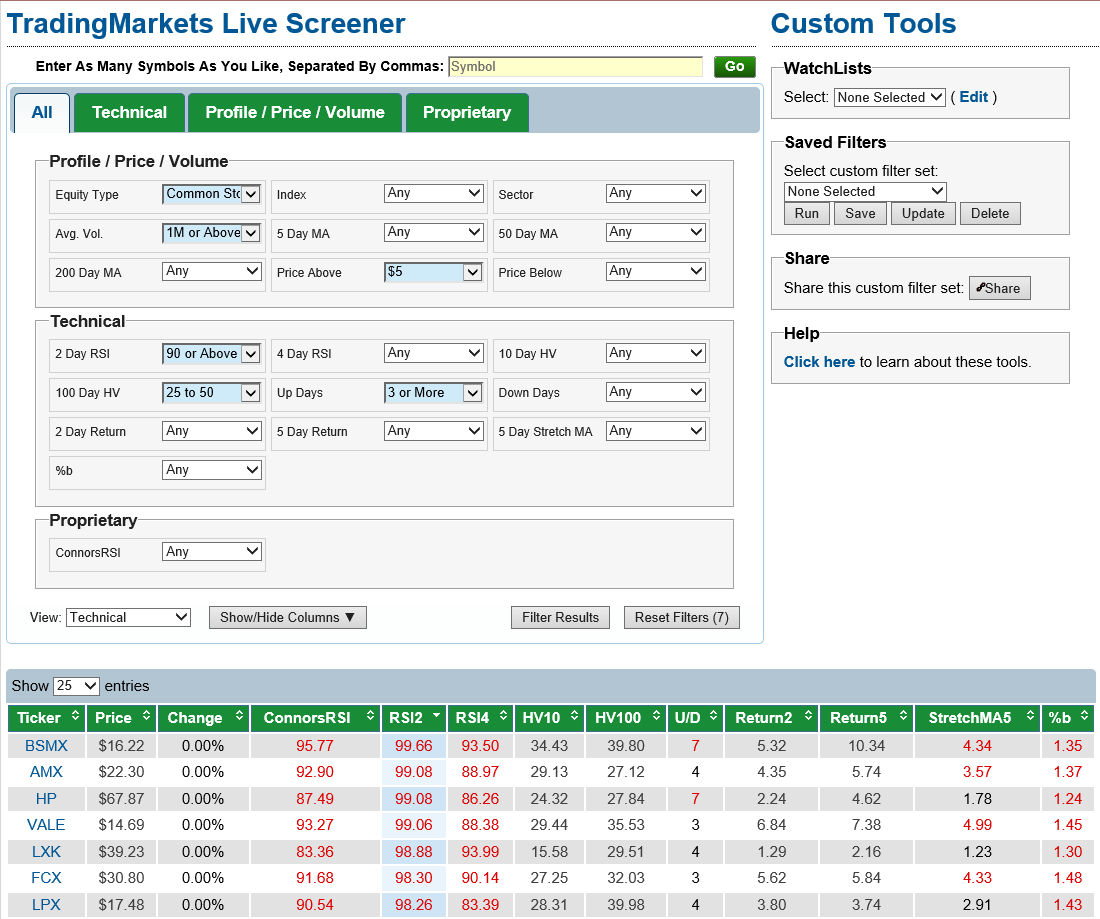
| Figure 2.: The Trading Markets Live Screener located 17 stocks that met the above screening criteria as of the close on Thursday August 8, 2013. |
| Graphic provided by: TradeStation. |
| Graphic provided by: Trading Markets Live Screener. |
| |
| Speculative bears may also want to monitor for signs of intraday exhaustion/reversal on 30- and 60-minute charts; look for a bearish key reversal bar and subsequent drop to get into a short trade, particularly if such weakness manifests somewhere between the 17.00 to 17.50 area. Consider running a two- to three-bar trailing stop of the hourly highs and watch the 16.50 area on the downside to act as potential support. No one knows if this will play out like this, but it's definitely one contingency plan to consider in a stock that doesn't have great fundamentals and may be getting a bit ahead of itself. Trade wisely until we meet here again. |
Freelance financial markets writer and online publisher of the Trendzetterz.com S&P 500 Weekly Forecast service.
| Title: | Market consultant and writer |
| Company: | Trendzetterz |
| Address: | 81 Hickory Hollow Drive |
| Crossville, TN 38555 | |
| Phone # for sales: | 904-303-4814 |
| Website: | trendzetterz.com |
| E-mail address: | support@trendzetterz.com |
Traders' Resource Links | |
| Trendzetterz has not added any product or service information to TRADERS' RESOURCE. | |
Click here for more information about our publications!
PRINT THIS ARTICLE

|

Request Information From Our Sponsors
- StockCharts.com, Inc.
- Candle Patterns
- Candlestick Charting Explained
- Intermarket Technical Analysis
- John Murphy on Chart Analysis
- John Murphy's Chart Pattern Recognition
- John Murphy's Market Message
- MurphyExplainsMarketAnalysis-Intermarket Analysis
- MurphyExplainsMarketAnalysis-Visual Analysis
- StockCharts.com
- Technical Analysis of the Financial Markets
- The Visual Investor
- VectorVest, Inc.
- Executive Premier Workshop
- One-Day Options Course
- OptionsPro
- Retirement Income Workshop
- Sure-Fire Trading Systems (VectorVest, Inc.)
- Trading as a Business Workshop
- VectorVest 7 EOD
- VectorVest 7 RealTime/IntraDay
- VectorVest AutoTester
- VectorVest Educational Services
- VectorVest OnLine
- VectorVest Options Analyzer
- VectorVest ProGraphics v6.0
- VectorVest ProTrader 7
- VectorVest RealTime Derby Tool
- VectorVest Simulator
- VectorVest Variator
- VectorVest Watchdog
