

HOT TOPICS LIST
- MACD
- Fibonacci
- RSI
- Gann
- ADXR
- Stochastics
- Volume
- Triangles
- Futures
- Cycles
- Volatility
- ZIGZAG
- MESA
- Retracement
- Aroon
INDICATORS LIST
LIST OF TOPICS
PRINT THIS ARTICLE
by Matt Blackman
Since peaking in September 2011, gold and gold stocks have taken it on the chin. But here is some compelling evidence that the worst could be over for the industry.
Position: N/A
Matt Blackman
Matt Blackman is a full-time technical and financial writer and trader. He produces corporate and financial newsletters, and assists clients in getting published in the mainstream media. He is the host of TradeSystemGuru.com. Matt has earned the Chartered Market Technician (CMT) designation. Find out what stocks and futures Matt is watching on Twitter at www.twitter.com/RatioTrade
PRINT THIS ARTICLE
HEAD & SHOULDERS
Is EGO Glittering Again?
08/14/13 03:07:41 PMby Matt Blackman
Since peaking in September 2011, gold and gold stocks have taken it on the chin. But here is some compelling evidence that the worst could be over for the industry.
Position: N/A
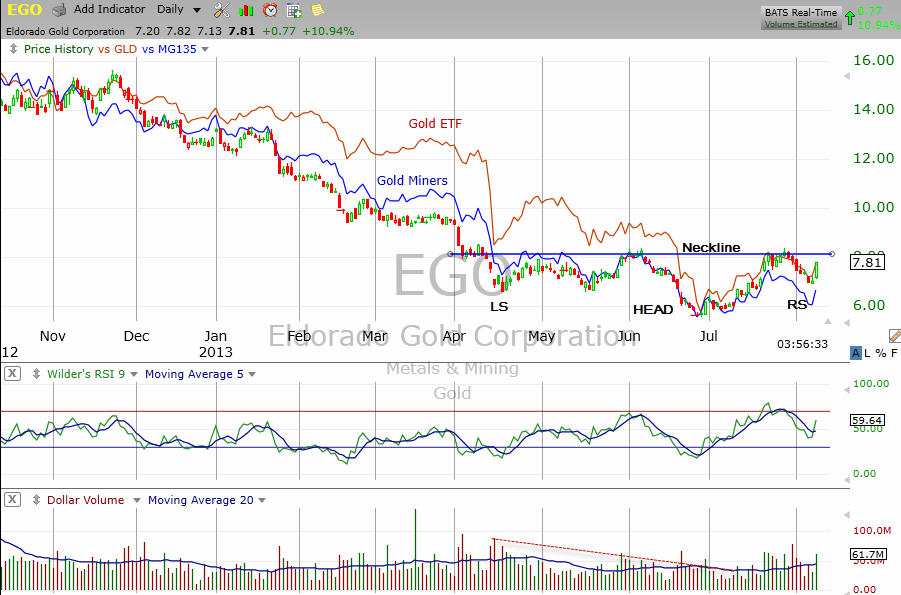
| In a recent stock scan, which looks at weekly data for stocks that are breaking out, Eldorado Gold (EGO) came up after jumping an impressive 11% on the day. I pulled up the chart and noticed that although gold and gold miners had languished since the fall of 2012, EGO looked to be in the process of putting in a powerful head & shoulders bottom pattern. Intrigued, I did some more homework. I was looking into the relationship between EGO and gold to see if the stock had led or lagged in past gold rallies. Here's what I found (Figure 1). |
|
| Figure 1 � Daily chart of Eldorado Gold (EGO), the SPDR Gold Trust ETF (GLD) and Gold Miners showing the potential EGO Head & Shoulders bottom pattern that looks to be in the process of forming with the neckline at $8.20. |
| Graphic provided by: TC2000.com. |
| |
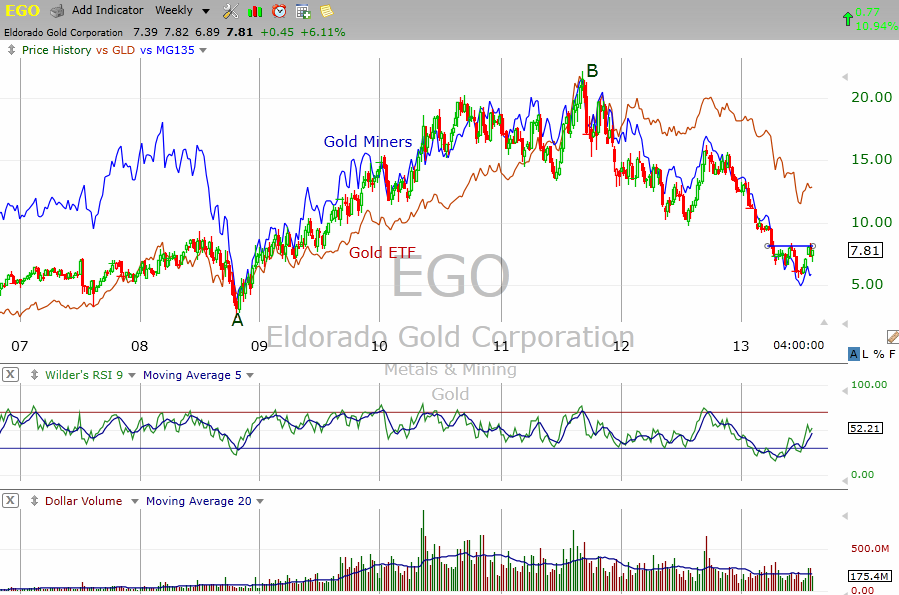
| In the chart in Figure 2 notice the longer-term relationship between EGO and GLD. GLD bottomed during the last week of October 2008 at $71.34. EGO had bottomed the week before at $3.21. Three years later during the week of September 2, 2011, GLD hit a weekly peak of $183.24 for a gain of 157%. EGO peaked a week later at $21.48 for a gain of 570%. So EGO had bottomed before gold and peaked a week later but more importantly, EGO shares had increased more than three times that of the gold ETF. If the EGO head & shoulders pattern is confirmed with a decisive break above the neckline at $8.20, the minimum projected upside target of the pattern will be $10.75 which would be a gain of more than 37% from the August 8, 2013 closing price. |
|
| Figure 2 � Weekly chart of Eldorado Gold (EGO), SPDR Gold Trust ETF (GLD) and Gold Miners showing the relationships between the three. Between Point A and Point B, EGO increased 570% while GLD increased 157%. |
| Graphic provided by: TC2000.com. |
| |
| Since peaking in September 2011, GLD has lost more than 30% which many (including yours truly) would say is overdone. Unless global economies enter prolonged periods of deflation, which must be considered an unlikely scenario, further drops in gold and precious metals are unlikely. But central banks, especially the Federal Reserve and European Central Bank, continue to do all they can to increase liquidity which is highly inflationary. |
| If the recent H&S bottom pattern is confirmed, Eldorado Gold could well be telling us that inflation is indeed accelerating and as a metal leader, EGO will be a big beneficiary. |
Matt Blackman is a full-time technical and financial writer and trader. He produces corporate and financial newsletters, and assists clients in getting published in the mainstream media. He is the host of TradeSystemGuru.com. Matt has earned the Chartered Market Technician (CMT) designation. Find out what stocks and futures Matt is watching on Twitter at www.twitter.com/RatioTrade
| Company: | TradeSystemGuru.com |
| Address: | Box 2589 |
| Garibaldi Highlands, BC Canada | |
| Phone # for sales: | 604-898-9069 |
| Fax: | 604-898-9069 |
| Website: | www.tradesystemguru.com |
| E-mail address: | indextradermb@gmail.com |
Traders' Resource Links | |
| TradeSystemGuru.com has not added any product or service information to TRADERS' RESOURCE. | |
Click here for more information about our publications!
PRINT THIS ARTICLE

Request Information From Our Sponsors
- StockCharts.com, Inc.
- Candle Patterns
- Candlestick Charting Explained
- Intermarket Technical Analysis
- John Murphy on Chart Analysis
- John Murphy's Chart Pattern Recognition
- John Murphy's Market Message
- MurphyExplainsMarketAnalysis-Intermarket Analysis
- MurphyExplainsMarketAnalysis-Visual Analysis
- StockCharts.com
- Technical Analysis of the Financial Markets
- The Visual Investor
- VectorVest, Inc.
- Executive Premier Workshop
- One-Day Options Course
- OptionsPro
- Retirement Income Workshop
- Sure-Fire Trading Systems (VectorVest, Inc.)
- Trading as a Business Workshop
- VectorVest 7 EOD
- VectorVest 7 RealTime/IntraDay
- VectorVest AutoTester
- VectorVest Educational Services
- VectorVest OnLine
- VectorVest Options Analyzer
- VectorVest ProGraphics v6.0
- VectorVest ProTrader 7
- VectorVest RealTime Derby Tool
- VectorVest Simulator
- VectorVest Variator
- VectorVest Watchdog