

HOT TOPICS LIST
- MACD
- Fibonacci
- RSI
- Gann
- ADXR
- Stochastics
- Volume
- Triangles
- Futures
- Cycles
- Volatility
- ZIGZAG
- MESA
- Retracement
- Aroon
INDICATORS LIST
LIST OF TOPICS
PRINT THIS ARTICLE
by Donald W. Pendergast, Jr.
Shares of Zimmer Holdings appear to be close to a meaningful breakout, and a key support test will likely determine their near-term direction.
Position: N/A
Donald W. Pendergast, Jr.
Freelance financial markets writer and online publisher of the Trendzetterz.com S&P 500 Weekly Forecast service.
PRINT THIS ARTICLE
ZMH : Breakout Approaches - But Which Way?
08/12/13 03:24:18 PMby Donald W. Pendergast, Jr.
Shares of Zimmer Holdings appear to be close to a meaningful breakout, and a key support test will likely determine their near-term direction.
Position: N/A
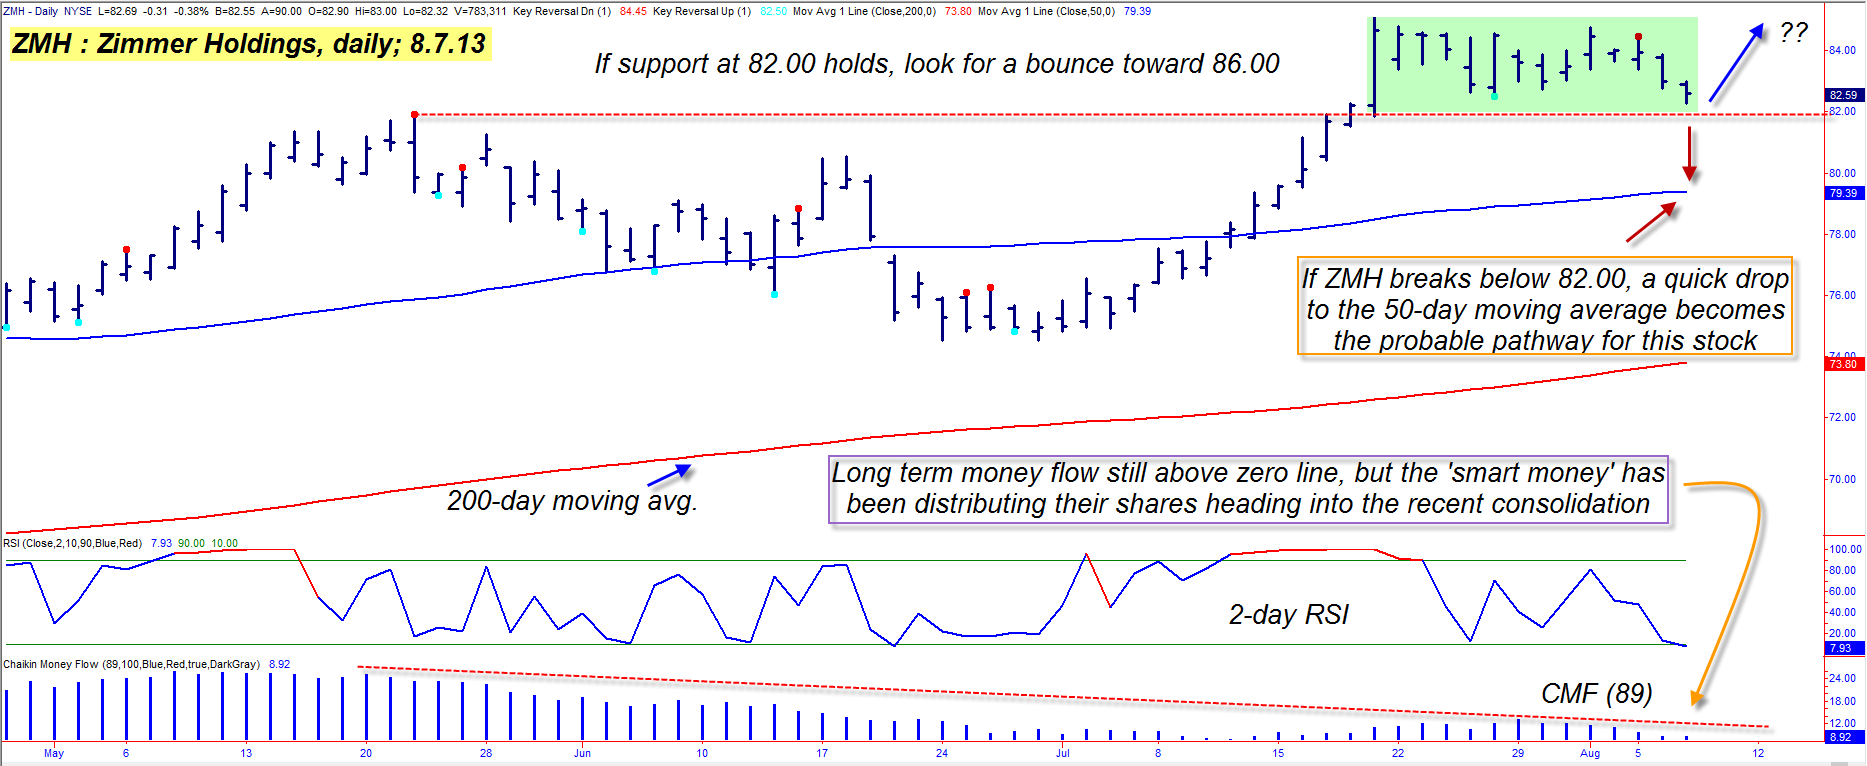
| Consolidation patterns, especially if well-formed, can be a real boon to discretionary traders looking for a logical mechanism to help time trade entries - long or short. Here's a look at a dandy of a consolidation pattern in Zimmer Holdings (ZMH) along with some ideas on how to potentially profit, no matter which way this stock soon decides to break (Figure 1). |
|
| Figure 1.: If ZMH breaks below pattern support at 82.00, look for a swift decline toward support near 80.00. |
| Graphic provided by: TradeStation. |
| |
| Since exploding higher out of a major multicycle low in December 2011, ZMH has offered traders dozens of tradable swing setups, many of which had the volatility needed to produce profitable outcomes - on the long side as well as the short side. However, ZMH's 20-month rally is now at a critical "make or break" point, what with its long-term money flow (based on the 89-day Chaikin Money flow [CMF][89] histogram) already confirming massive distribution underway even as the stock rests just above a critical area of daily chart support. You can see just how weak the money flow histogram trend is - its recent high was far lower than the one it made back in May 2013, even though ZMH still managed to power on up to new highs. This confirms that latecomers were doing the bulk of the buying during the stock's latest six-week rally, rather than pro institutional traders (who account for about 80% of all stock market volume). Now notice the green shaded consolidation area; this really sets the stage for three potential scenarios in ZMH over the next few weeks: 1. A mild bounce off of the red support line at 82.00, resulting in a rise to the upper end of the green box, with profit takers ending the run, keeping ZMH locked in a range. 2. An even stronger rally off of the same support line, one allowing ZMH to break above the range and into a continuation move, perhaps up toward the 90.00 area. 3. A breakdown of support at 82.00, resulting in a swift decline to support near the 80.00 level, close to its 50-day moving average (blue line). |
|
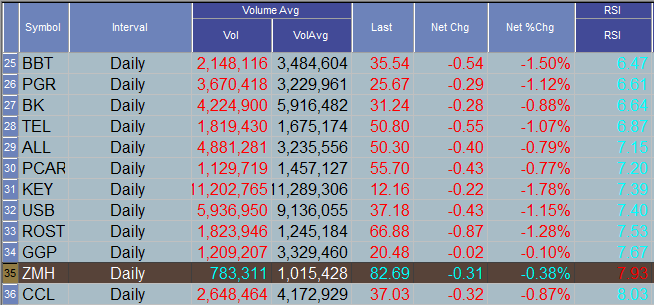
| Figure 2.: ZMH has decent average daily trading volumes for swing traders; note the deeply oversold 2-day RSI reading as the stock approaches a critical pattern support level. |
| Graphic provided by: TradeStation. |
| Graphic provided by: TradeStation Radar Screen. |
| |
| While all three of these scenarios or variations thereof - are possible, it might pay to be most prepared to capitalize on a potential drop below support at 82.00 given the heavy distribution trend underway; the latecomers who were doing the buying coming out of the late June 2013 cycle low are going to be the first to panic if that support level breaks and in the absence of heavy professional buying, ZMH looks like an easy ride down to the 80.00 in just a few trading sessions. If you do short on a break below 82.00, set your initial stop just above 83.00 and run a two-bar trailing stop of the daily highs until either 80.00 is reached (closing the trade out there) or you get stopped out. You can also consider playing the anticipated move south by buying the September '13 ZMH $85.00 put, which is currently selling for about 3.50 and has an open interest figure of 222 contracts. By no means allow the put to decline in value by more than 50% and use the same 80.00 profit target on the stock as your profit-taking target. Risk no more than 1-2% of your account value on this trade, depending on your level of trading experience. Trade wisely until we meet here again. |
Freelance financial markets writer and online publisher of the Trendzetterz.com S&P 500 Weekly Forecast service.
| Title: | Market consultant and writer |
| Company: | Trendzetterz |
| Address: | 81 Hickory Hollow Drive |
| Crossville, TN 38555 | |
| Phone # for sales: | 904-303-4814 |
| Website: | trendzetterz.com |
| E-mail address: | support@trendzetterz.com |
Traders' Resource Links | |
| Trendzetterz has not added any product or service information to TRADERS' RESOURCE. | |
Click here for more information about our publications!
PRINT THIS ARTICLE

Request Information From Our Sponsors
- VectorVest, Inc.
- Executive Premier Workshop
- One-Day Options Course
- OptionsPro
- Retirement Income Workshop
- Sure-Fire Trading Systems (VectorVest, Inc.)
- Trading as a Business Workshop
- VectorVest 7 EOD
- VectorVest 7 RealTime/IntraDay
- VectorVest AutoTester
- VectorVest Educational Services
- VectorVest OnLine
- VectorVest Options Analyzer
- VectorVest ProGraphics v6.0
- VectorVest ProTrader 7
- VectorVest RealTime Derby Tool
- VectorVest Simulator
- VectorVest Variator
- VectorVest Watchdog
- StockCharts.com, Inc.
- Candle Patterns
- Candlestick Charting Explained
- Intermarket Technical Analysis
- John Murphy on Chart Analysis
- John Murphy's Chart Pattern Recognition
- John Murphy's Market Message
- MurphyExplainsMarketAnalysis-Intermarket Analysis
- MurphyExplainsMarketAnalysis-Visual Analysis
- StockCharts.com
- Technical Analysis of the Financial Markets
- The Visual Investor